
Visual thinking vs Design Thinking: Bringing the two together
Reading time: about 7 min
Best-selling author Louise Hay said, “I don’t fix problems. I fix my thinking. Then problems fix themselves.” This quote can apply to all sorts of circumstances, including the next time that you’re unsure what your customers need from your product. Maybe you just need a new way of looking at the problem.
Let’s discuss two modes of thinking—visual thinking and Design Thinking—and the ways these two methods complement each other to help you design and produce products that delight your customers.
What is visual thinking?
Think about the last time you passed a traffic sign—you likely processed the color, shape, or icons on the sign before you processed any of the words, if it had any words at all. Traffic signs demonstrate how powerful visuals can be in communicating an idea quickly.
Stakeholders don’t understand your description of a cloud architectural design? Draw a picture to show them what you mean. You don’t need to be an artist. Simple shapes and lines can go a long way to help you convey meaning to complex ideas that words alone can’t express.
Most of us are inclined to think visually. Visuals help you process information faster and recall information for a longer period of time. They can also help you organize and form ideas, making it easier for your audience to follow your train of thought.
Common tools used in visual thinking include drawings on whiteboards or paper (physical or virtual), flowcharts, slide presentations, and so on. These visualization tools help to bring clarity to the information you present so that your audience can ask better questions, make better suggestions, and collaborate more confidently.
What is Design Thinking?
While visual thinking is the process of using pictures to organize thoughts and form new ideas, Design Thinking is an established process used to solve specific problems. It helps you to understand your customers and their pain points better. This understanding helps you to create deliverables that give them a positive user experience.
The Design Thinking process includes these five stages:
- Empathize: Design with your user in mind. Don’t just guess what they want or what they are thinking. Meet with them and ask questions. Understand their problems by getting to know your users.
- Define the problem: Use the information gathered from your customers to define the problem that needs to be fixed.
- Ideate: Brainstorm ideas that can fix the problem you identified. Record every idea no matter how big, small, complex, or simple so you can thoroughly explore all options and hone in on the right solution.
- Prototype: After deciding on a few unique solutions, build some prototypes, look at the functionality and flow, and determine which solution you should continue exploring.
- Test: Release your best solution for extensive testing.
This process is repeated as often as necessary. It’s a non-linear, iterative process—you might need to jump from the testing phase back to the defining phase or anywhere in between. You may have to go through many iterations before you release a solution that works well for most people.
Using visuals in the Design Thinking process
It’s not a huge leap to see that visual thinking can support and enhance the Design Thinking process. Designers who think visually can make connections, reveal new insights, and bring clarity to their user research and proposed solutions in order to more effectively communicate with team members, managers, and other stakeholders.
In each stage of the Design Thinking process, visuals come in handy for fleshing out ideas and helping other people to understand what you are trying to do.
Empathize
Visual thinking leads to a better understanding of your customers and how they use your products. Your visualizations can be as high-tech or low-tech as you want. Whatever gives you a clearer picture of your user experience is the right solution for you.
With that in mind, here are a few things you might want to try.
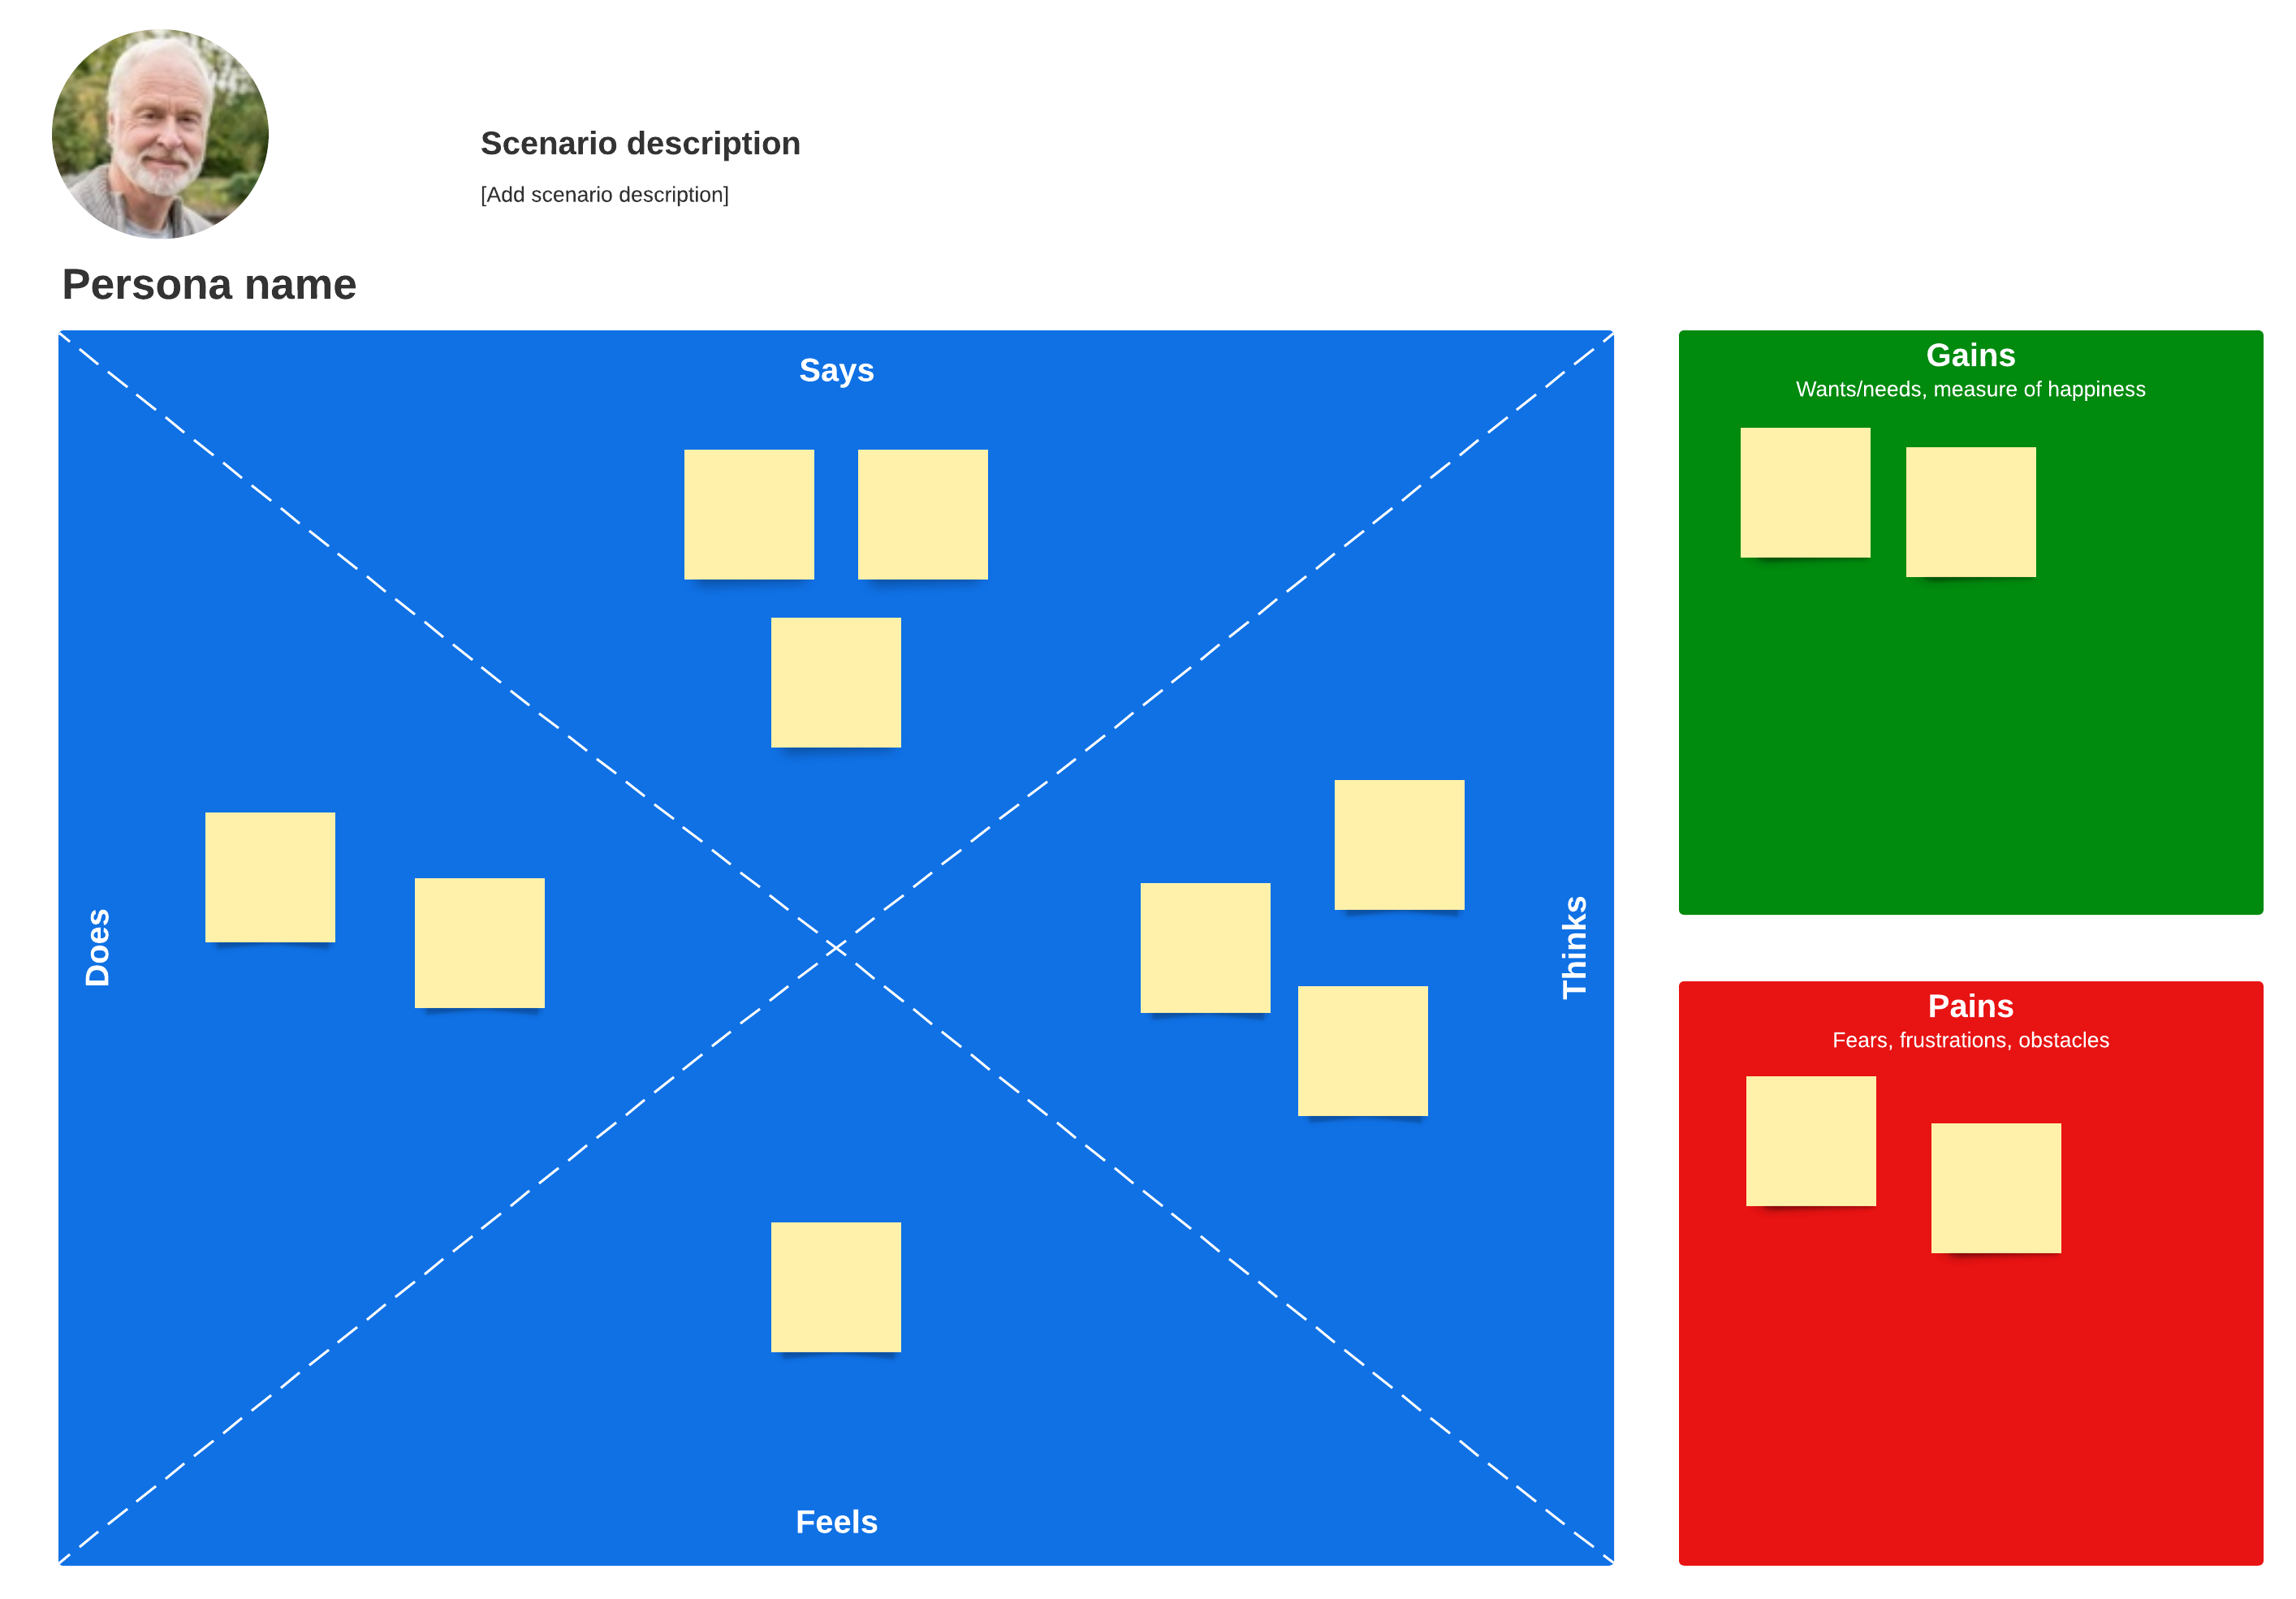
Create an empathy map
An empathy map is drawn as a square with the customer at the center. The square is divided into four quadrants that examine what the customer says, thinks, feels, and does. This map keeps you focused on what the customer needs and helps you to arrange your research data into an easy-to-read visual presentation.
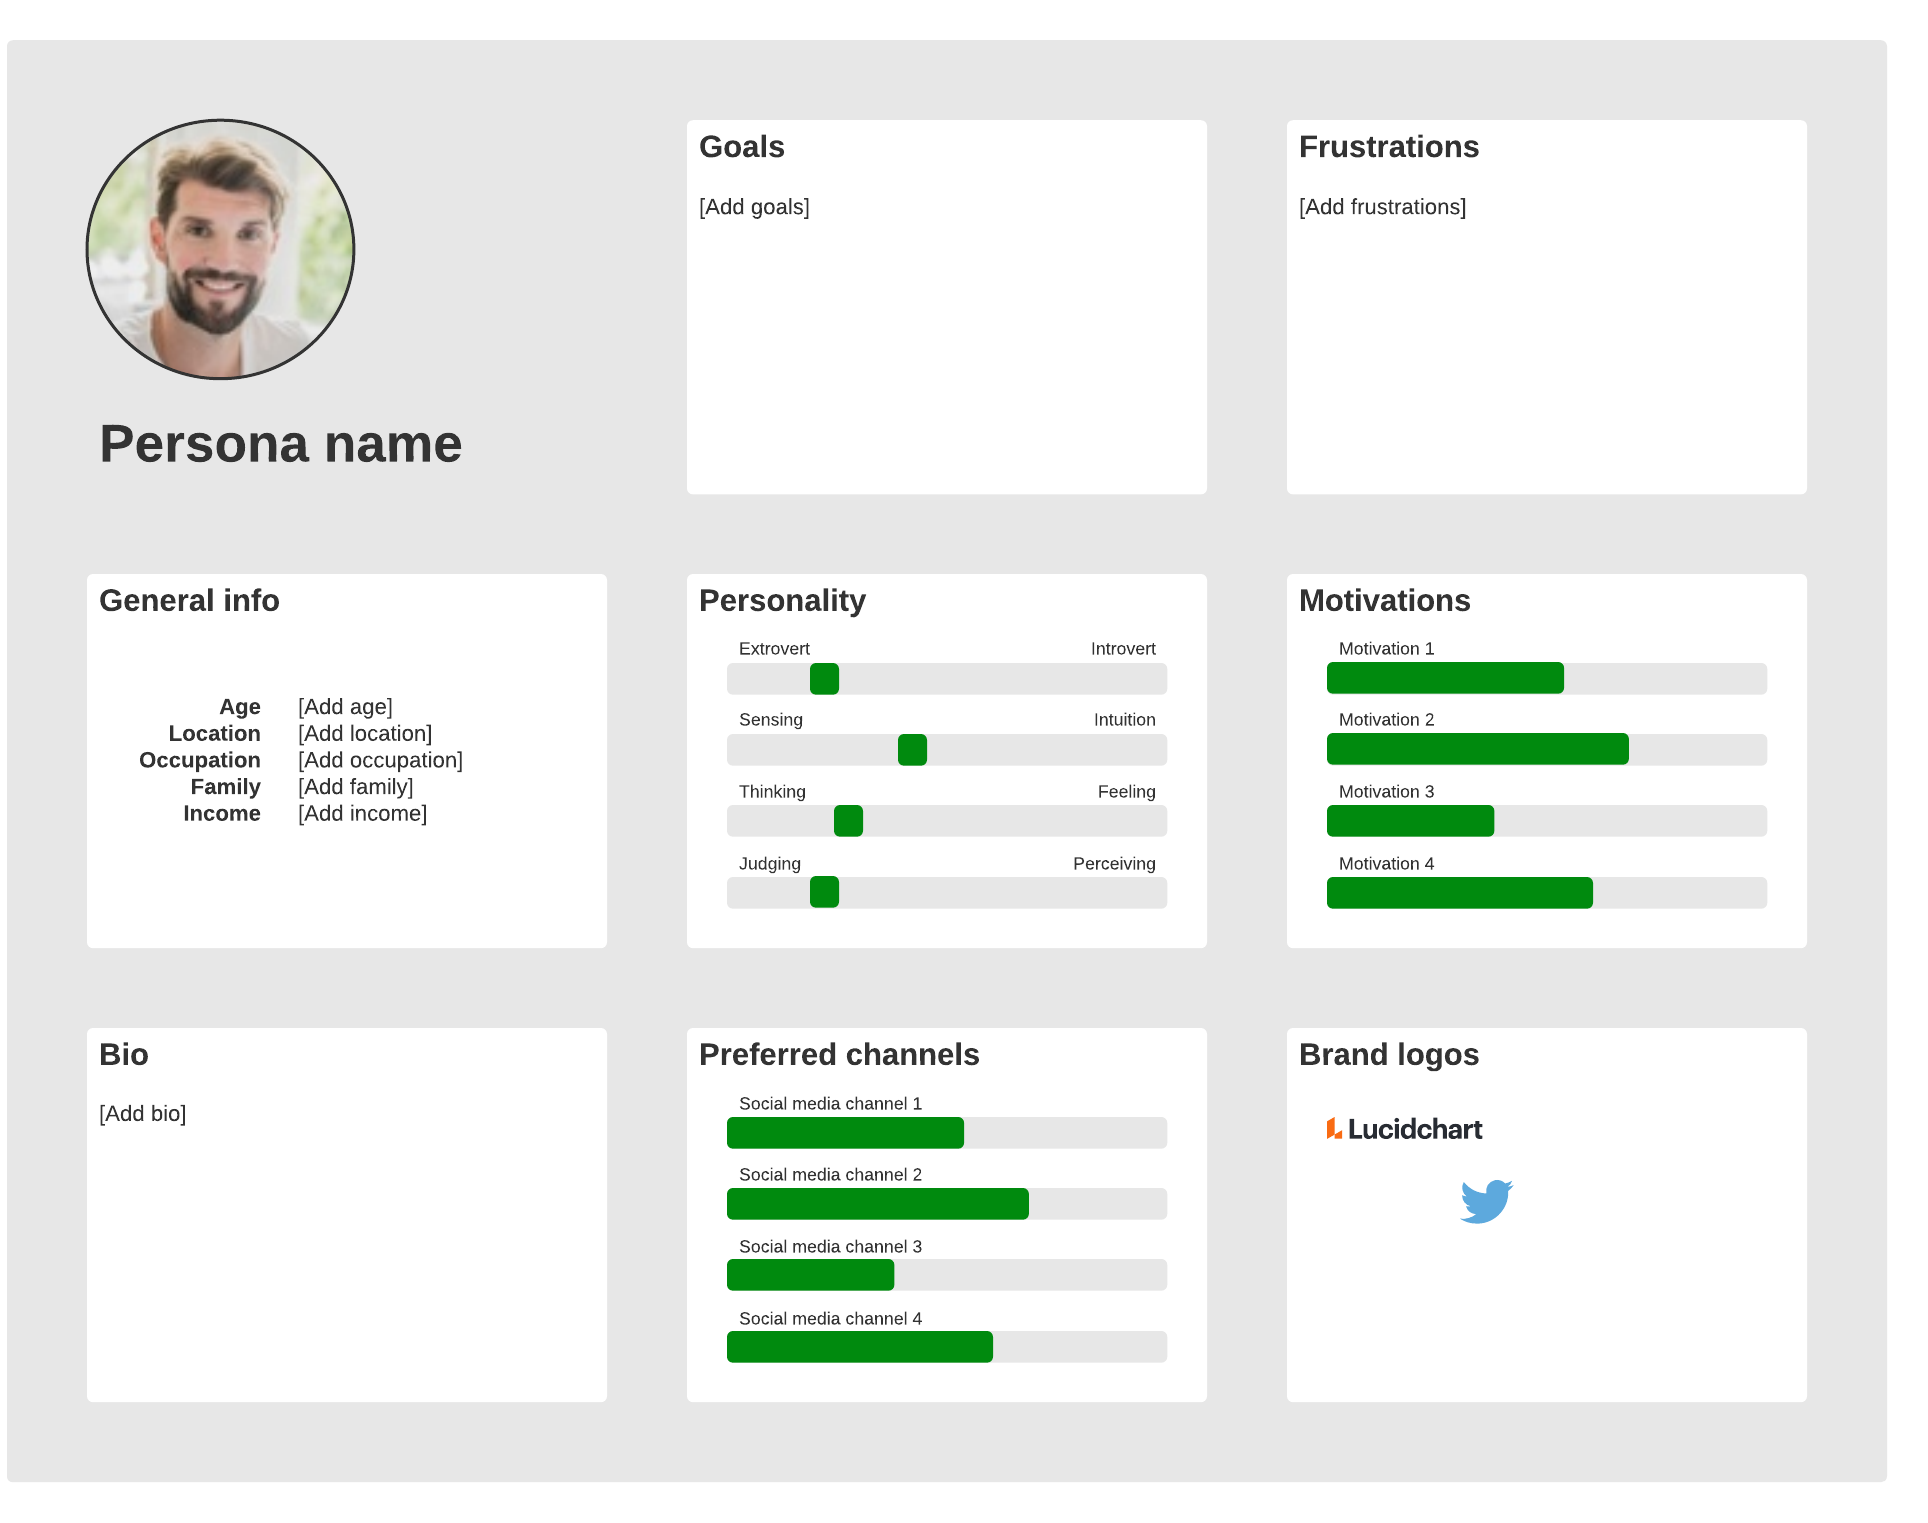
Create user personas
This exercise of creating user personas helps you to understand your target audience by creating a representation of your ideal customer. Through a process of observing current customer behavior and interviews, you can figure out who the customer is, what their main goal is, and what barriers keep them from achieving that goal.
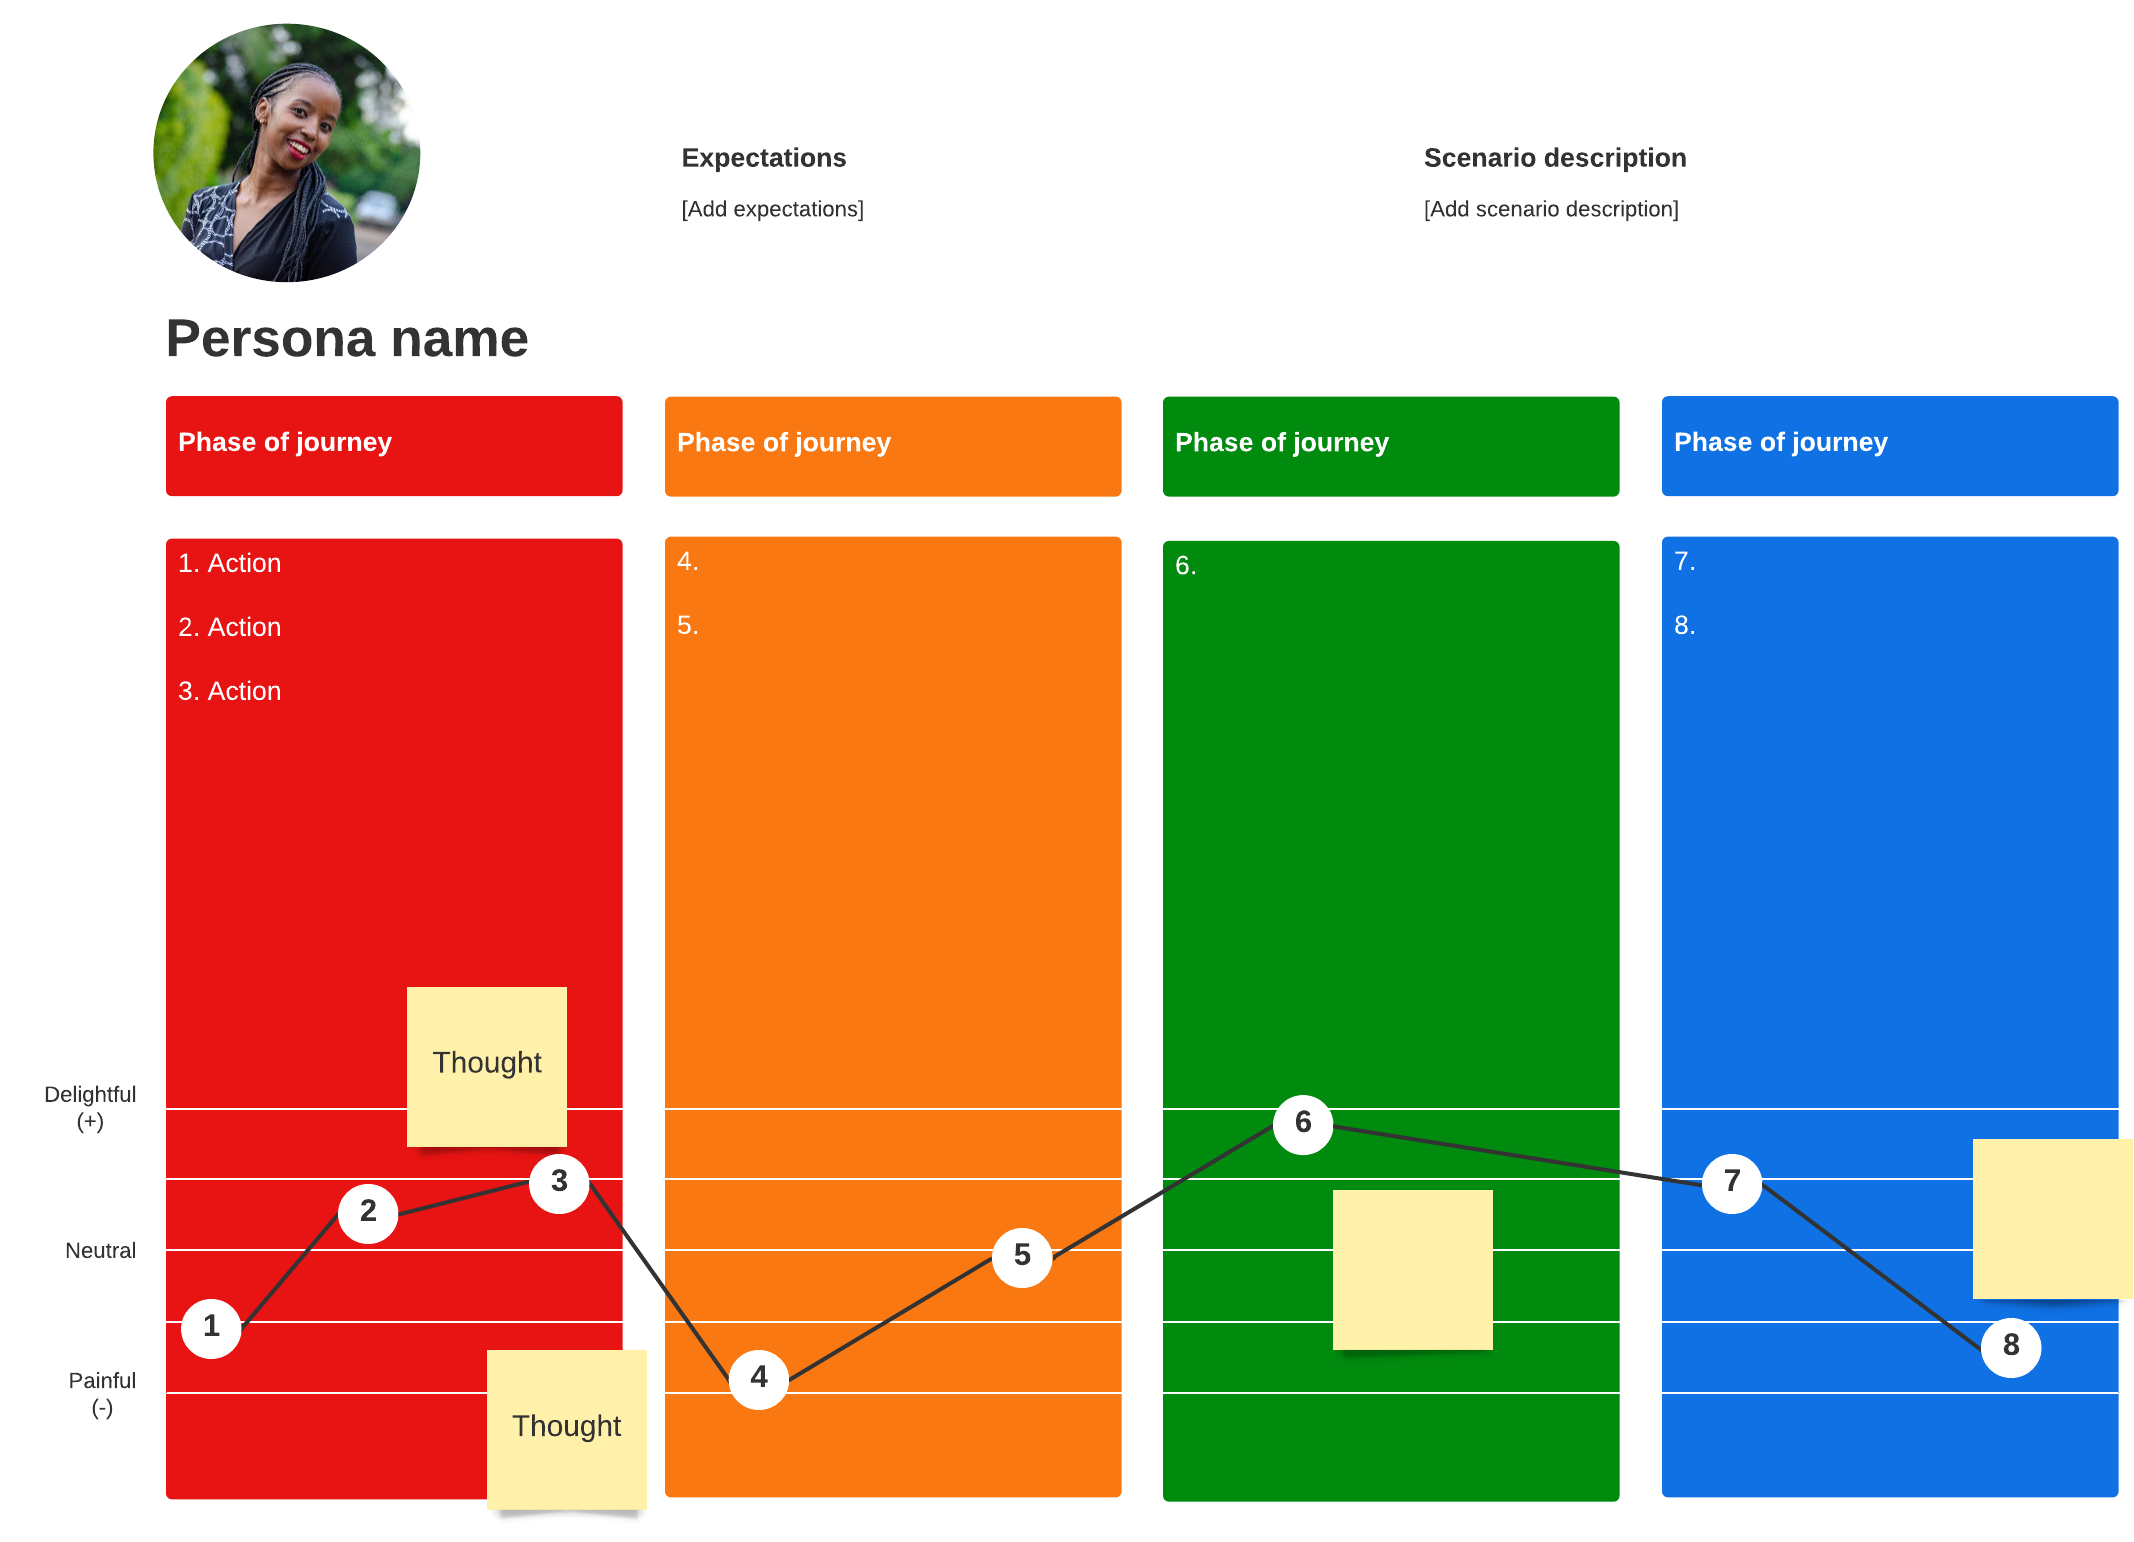
Create customer journey maps
A customer journey map visually tells you about your customers and their interactions and experiences with your products and services. Customers interact with your products and your brand through email, social media, online storefronts, brick-and-mortar stores, and so on.
Making a visual map of these interactions from the customer perspective gives you insight into the overall customer experience and helps to ensure that no customers are forgotten.
Define the problem
There are many different visual aids you can use to identify the problem you need to solve. Whichever tool helps you to brainstorm ideas, see patterns, and make relevant connections is the right one for you to use. Visualizing information leads to more clarification of the problem for you and all stakeholders.
Cause-and-effect diagram (also known as a fishbone or Ishikawa diagram)
This diagram helps you to categorize the potential causes of a problem so you can hone in on the root cause. Brainstorming and analysis help you to find a solution to the root of your problem.
Mind maps
A mind map is a good tool for brainstorming and gathering and organizing data. These diagrams usually are built around a central concept drawn on the canvas. From there, you branch out to related ideas. Each idea can branch out into additional ideas that all relate back to the central idea. It’s a way to visually brainstorm without adhering to a strict structure.
Current and future state mapping
Visually map out your customers’ current state. How do they interact with your product now? Are they using it efficiently? Do they miss important features that could save them time? Are they encountering roadblocks? After gathering current state data, map out where the product needs to go in the future to address customer needs and concerns.
Collaborate on idea boards
As the name implies, an idea board is a place to record ideas. These can be whiteboards or glass walls in conference rooms or virtual canvasses that can be accessed from the cloud.
Ideate
In the ideation stage, drawing a sketch, doodling, or even just writing down and grouping ideas on sticky notes activates a different part of your brain, helping you to see the information that matters the most.
Try using a digital whiteboard with your teammates to keep them engaged and gather more creative and original ideas during the ideation process.

Check out these helpful tips to make the most out of your next ideation session.
Read morePrototype
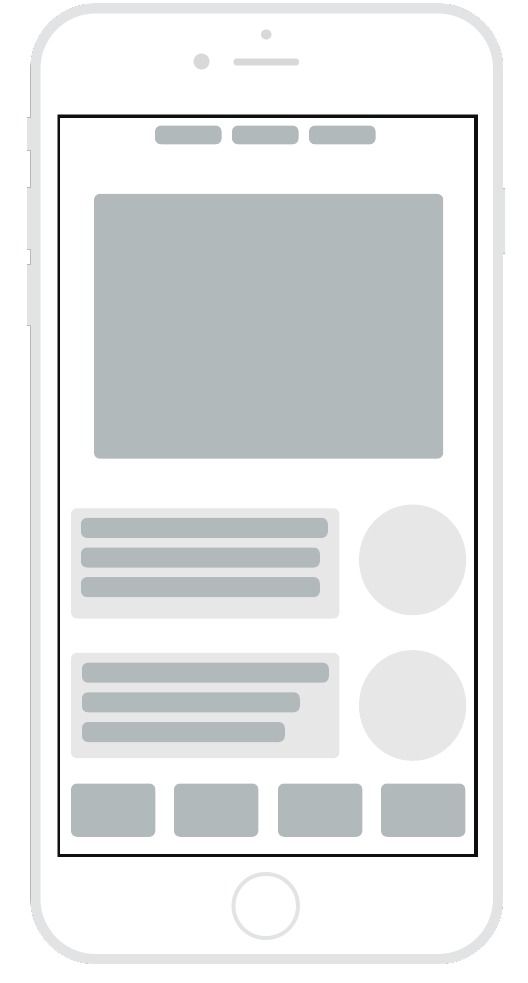
Wireframes and other visual mockups are a great way to prototype your idea to ensure that it can work in the real world, has a good flow, and makes sense to customers.
A visual prototype is anything that gives you an idea of how a product will function. It can be as simple as a sketch on a piece of paper or a wireframe created on a digital canvas. The wireframe uses simple shapes and lines to indicate buttons, actions, and the general flow of the interface.
Testing
During the testing phase, visuals can be used to capture ideas for refining and improving the product.
Try Lucidspark, a versatile, digital whiteboard that lets you share and capture ideas in real time from anywhere in the world. The collaborative nature of Lucidspark lets you work together and hone in on the best ideas that will address your customers’ pain points. Then move your best ideas to Lucidchart and create workflows, wireframes, and other visual documents to bring your ideas to life.

Make your Design Thinking approach visual with Lucidspark. Sign up today to get started.
Start nowAbout Lucidspark
Lucidspark, a cloud-based virtual whiteboard, is a core component of Lucid Software's Visual Collaboration Suite. This cutting-edge digital canvas brings teams together to brainstorm, collaborate, and consolidate collective thinking into actionable next steps—all in real time. Lucid is proud to serve top businesses around the world, including customers such as Google, GE, and NBC Universal, and 99% of the Fortune 500. Lucid partners with industry leaders, including Google, Atlassian, and Microsoft. Since its founding, Lucid has received numerous awards for its products, business, and workplace culture. For more information, visit lucidspark.com.
Bring your bright ideas to life.
or continue with


By registering, you agree to our Terms of Service and you acknowledge that you have read and understand our Privacy Policy.