
5 steps for creating project KPIs to align team goals and objectives
Reading time: about 9 min
Topics:
When it comes to achieving success by planning ahead, Abraham Lincoln famously said, “Give me six hours to chop down a tree and I will spend the first four hours sharpening the axe.”
Planning to achieve success is one thing. But how is success defined? For team leads, project managers, product managers, or any other performance-driven professional, that answer varies by project or team. Within a fast-paced organization, even those parameters evolve with time.
This is precisely why KPIs are such an invaluable measure of success for any tech-minded business.
What is a KPI?
KPI stands for Key Performance Indicator. KPIs give individuals and teams the focus they need to enact strategic improvements by showing where progress is being made toward an intended result. KPIs also provide a non-biased means for decision-making.
When using a KPI to measure success, desired performance is defined as a target. Progress is measured against those targets by means of leading indicators (looking ahead at future events or outcomes) and lagging indicators (looking to the past to see if those results were achieved).
For example, current customer satisfaction or brand recognition is viewed as a leading indicator for a product. Last year’s revenue is a lagging indicator since it shows what already happened.
Simply put, KPIs allow data-driven organizations to remain responsive to customer behaviors.
KPIs are unique to every organization and must correspond to specific outcomes. Surprisingly enough, coming up with the series of KPIs most relevant to your company doesn’t have to get too complicated.
How to create KPIs
Putting together KPIs for your company takes a strategic approach. Without focus or discipline, the list of possibilities can become endless.
When creating KPIs, define your objectives by identifying the questions you most need answered about the state of your business.
1. Establish the context of your KPIs
When it comes to prioritizing business objectives, clarity is a must. After all, you're selecting "key" performance indicators—not just any performance indicators.
That depends on your business goals and strategy. This is why it’s so important to identify the circumstances that will shape the who, what, why, how, and when of your KPIs.
A simple, effective way to establish the context of KPIs is to create a business model canvas.
The business model canvas offers a one-page summary of how your business should perform according to the best information at hand. Created by business theorist Alexander Osterwalder in the mid-2000s, it’s an effective way for helping companies condense strategic KPI planning.
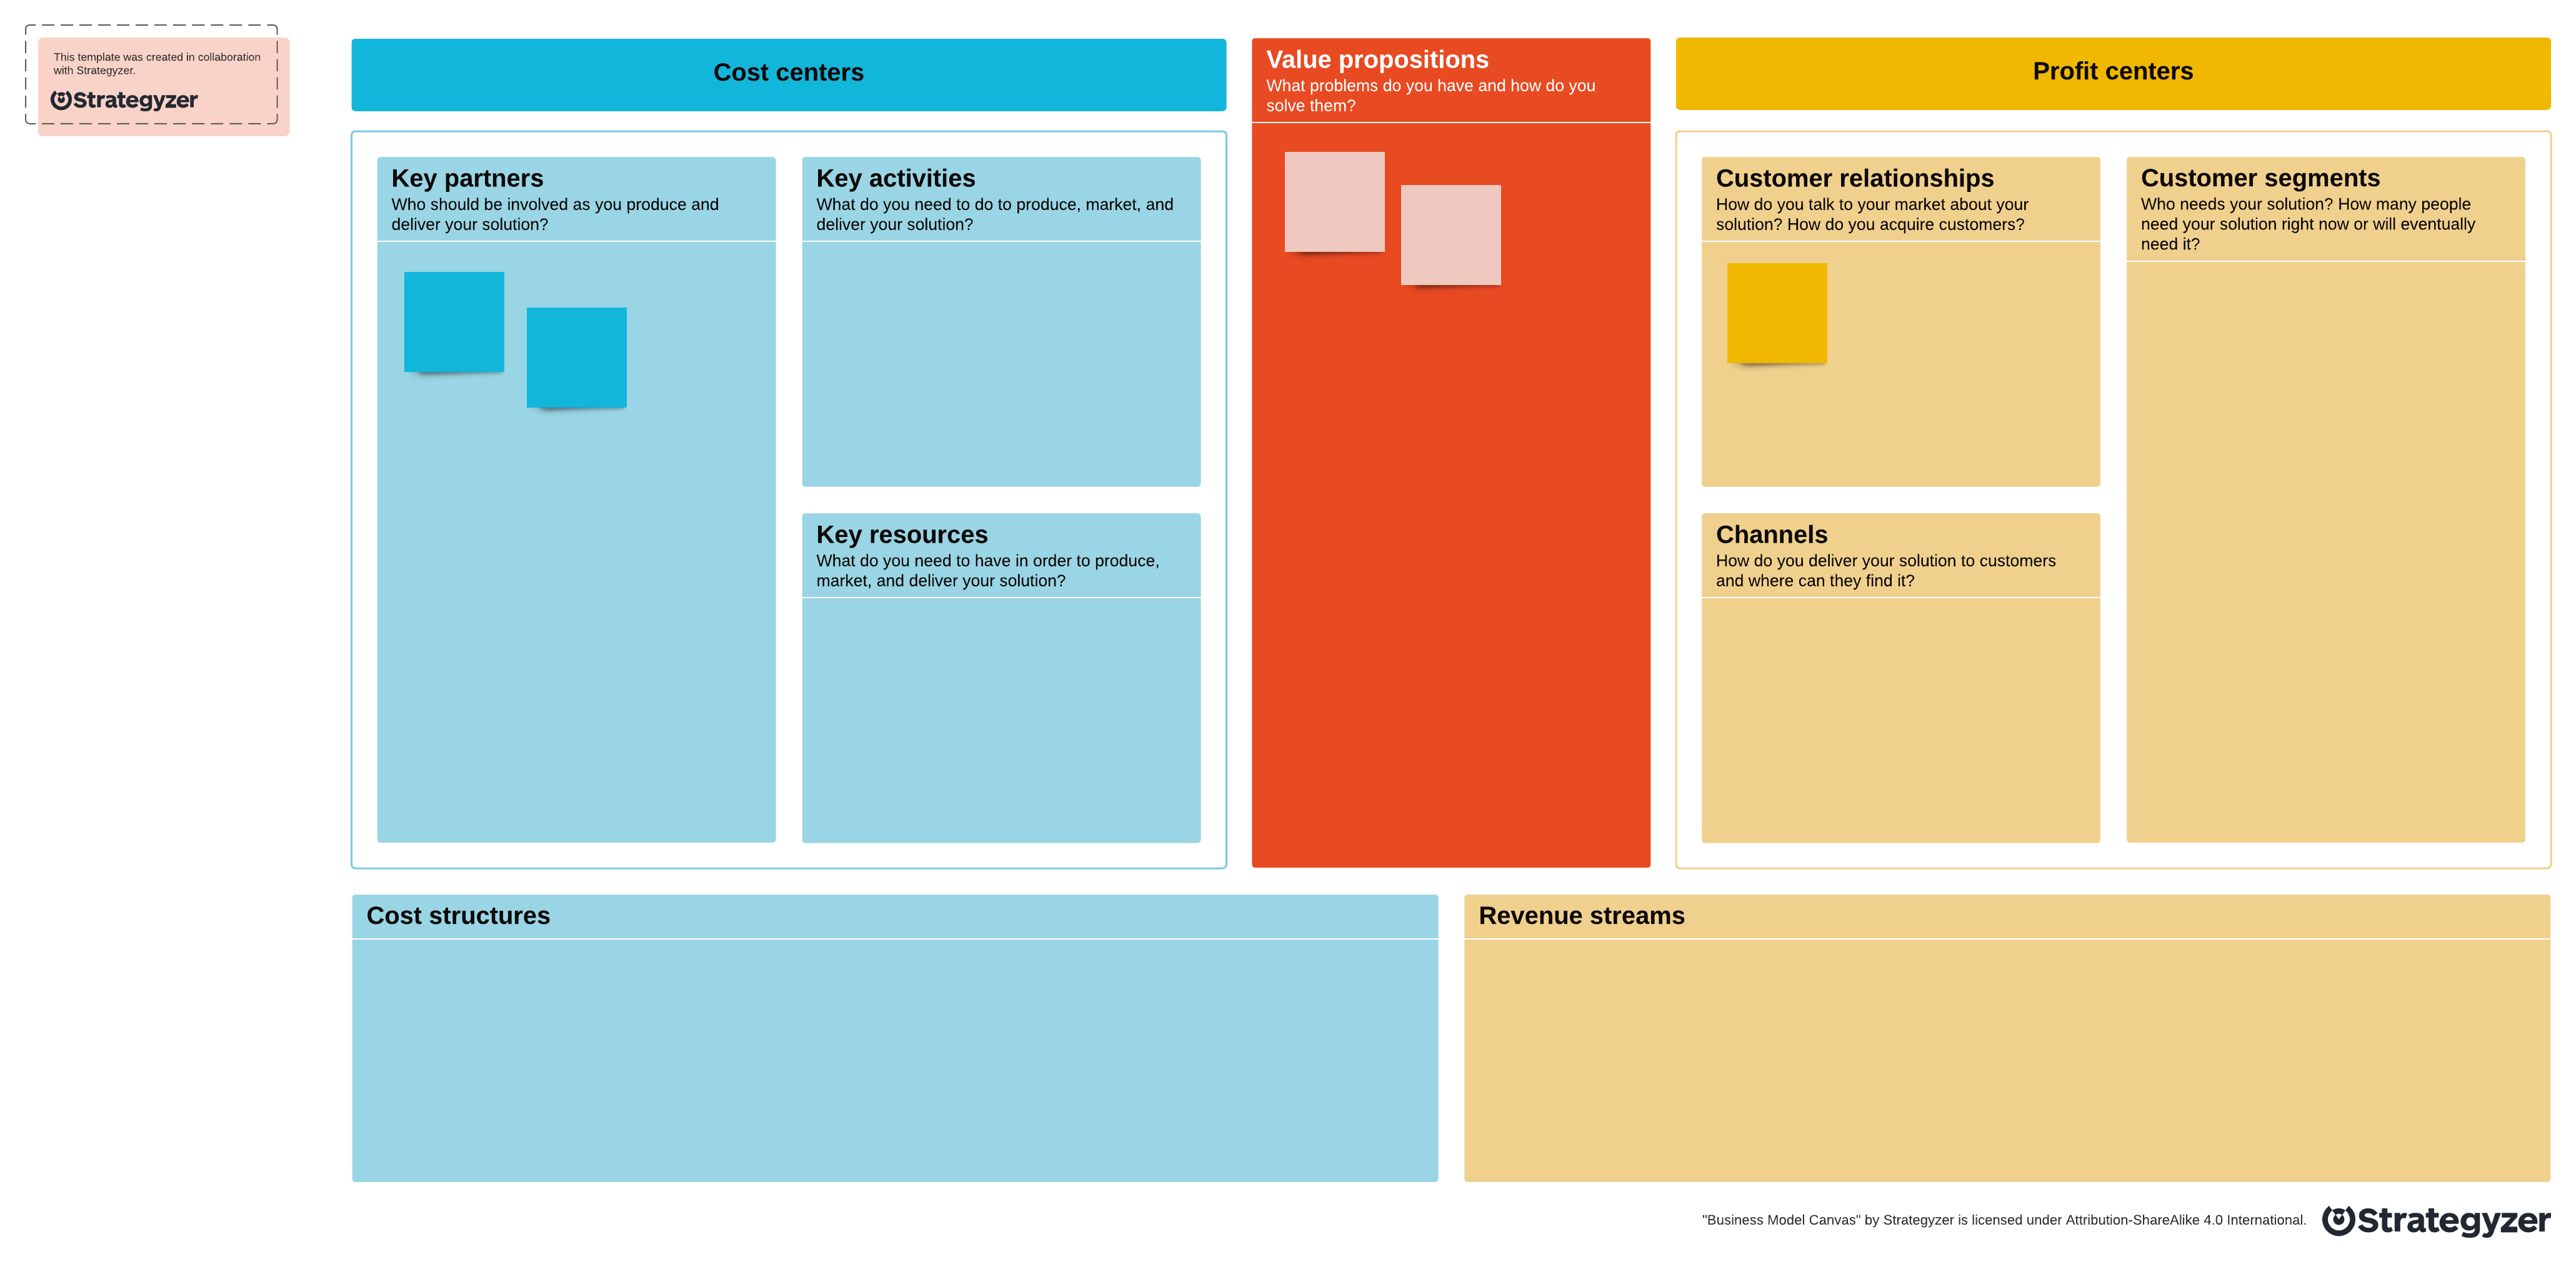
Think of it as a mini business plan. Some of the key elements of a business model canvas are:
- Value proposition. This should inform everything you do in a single sentence. It can be your mission, the problem you hope to solve, or the product/service you’re developing.
- Customer relationships. Here is where you define how (or where) you communicate with each customer segment, build rapport, and tell them why your solution is the best.
- Customer and market segments. These are the people, groups, or organizations who could really benefit from your solution. Finding them will take investigation and research.
- Channels. Once you’ve identified all your different segments, these are the points where interactions are made, value is delivered, and customers readily access your solutions.
- Key partners. Producing, marketing, and delivering your solution to customers will often require working with other people. This list includes suppliers, distributors, and vendors.
- Revenue streams and pricing model. What will customers pay and how will they pay for your product/service? One-time purchase or subscription, ensure costs are covered.
When it comes to creating KPIs, a Business Model Canvas is a great way to establish the necessary context and hone in on your most important metrics of success.
2. Identify your short-term and long-term goals
Keep your goals qualitative at this point. Plan to brainstorm KPIs both individually and as a team with a focus on how performance will be measured. Try to ask KPI-minded questions such as:
- What is the ideal outcome for this product/service launch?
- What makes this outcome important to our organization?
- How will our progress toward this outcome be measured?
- What actions influence our achievement of this outcome?
- Who/what team is ultimately responsible for this outcome?
- How often will we review/adjust progress for this outcome?
By their size and nature, some goals (e.g., brainstorm 50+ potential product names, then reduce to a final five) can be quickly assigned and accomplished. All of those make for ideal short-term goals to help shape your KPIs. In contrast, going from concept to product launch in 18 months is a more long-term endeavor and involves tracking more people, resources, and milestones.
Once everyone has ideated and compiled their short- and long-term goals, it will prove helpful to sort them into categories. To align with your solution timeline, those categories could reflect the stage where those goals fit into the project lifecycle: initiation, planning, execution, and closure.
3. Define the key metrics of success for each goal
This is where quantitative metrics become part of the KPI creation process. Identify which KPI metrics are most important to the marketing, sales, or finance departments at your organization and then make use of the standard business performance metrics those teams are familiar with:
- MRR. Monthly recurring revenue is a critical metric, especially for SaaS companies. It’s a normalized measure of predictive revenue, giving insight into current financial status. For example, if a business has 12 subscribers paying $500 a month, then its MRR is $6000.
- NRR. Similar to MRR, net revenue retention is your recurring revenue percentage in a given time period after accounting for cancellations, downgrades, or expansion revenue. Any NRR > 100% indicates growth. Most enterprise SaaS companies strive for an NRR > 125%.
- CPA. Cost per acquisition is a common metric. And why it’s better to retain a customer than attract new ones. CPA is calculated by dividing the total cost to acquire customers by the number of customers acquired. Profitability means recouping CPA through sales.
- NPS. Net promoter score is a measurement of customer loyalty. Popularized by the 0-10 score satisfaction surveys (0= not at all likely, 10=extremely likely). NPS falls into one of three categories, loyal Promoters 9-10, satisfied Passives 7-8, and the Detractors 0-6.
- Revenue Growth. A simple and effective measurement of performance. Just track sales revenue for a period. Let’s say Q2. Subtract Q1’s total sales revenue from Q2’s revenue. Divide that number by Q1’s total revenue. Positive or negative, that’s the revenue growth.
Other standard business metrics for KPI measurements included conversion, the percentage of customers attained by sales efforts and retention, the percentage of customers retained versus those lost to competitors, changing customer interests or needs, and product dissatisfaction.
Many customer success and product managers also use standard product performance metrics that measure use, interaction, and likability of products after they’ve been sold or released, like:
- Feature adoption. A common user activation metric that expresses how many users interact with a product feature. Unused features lower perceived value and vice versa.
- Product adoption. This is a measurement of user activation for a mobile or web app.
- User actions within sessions. When someone visits a site, this is a measure of how engaged they are across pageviews, clicks, video plays, and more within a session.
- DAU. Daily active users after product adoption. Or, once they have the app, this is how many customers engage with it. The metrics being if they open or view it on a given day.
- MAU. Monthly active users, this is the aggregate sum of DAU over a one-month period.
When looking for ways to measure the performance aspect of a KPI, there is no lack of metrics to inform your research. Choose metrics that are most relevant to your product, service, or solution and that provide actionable insights.
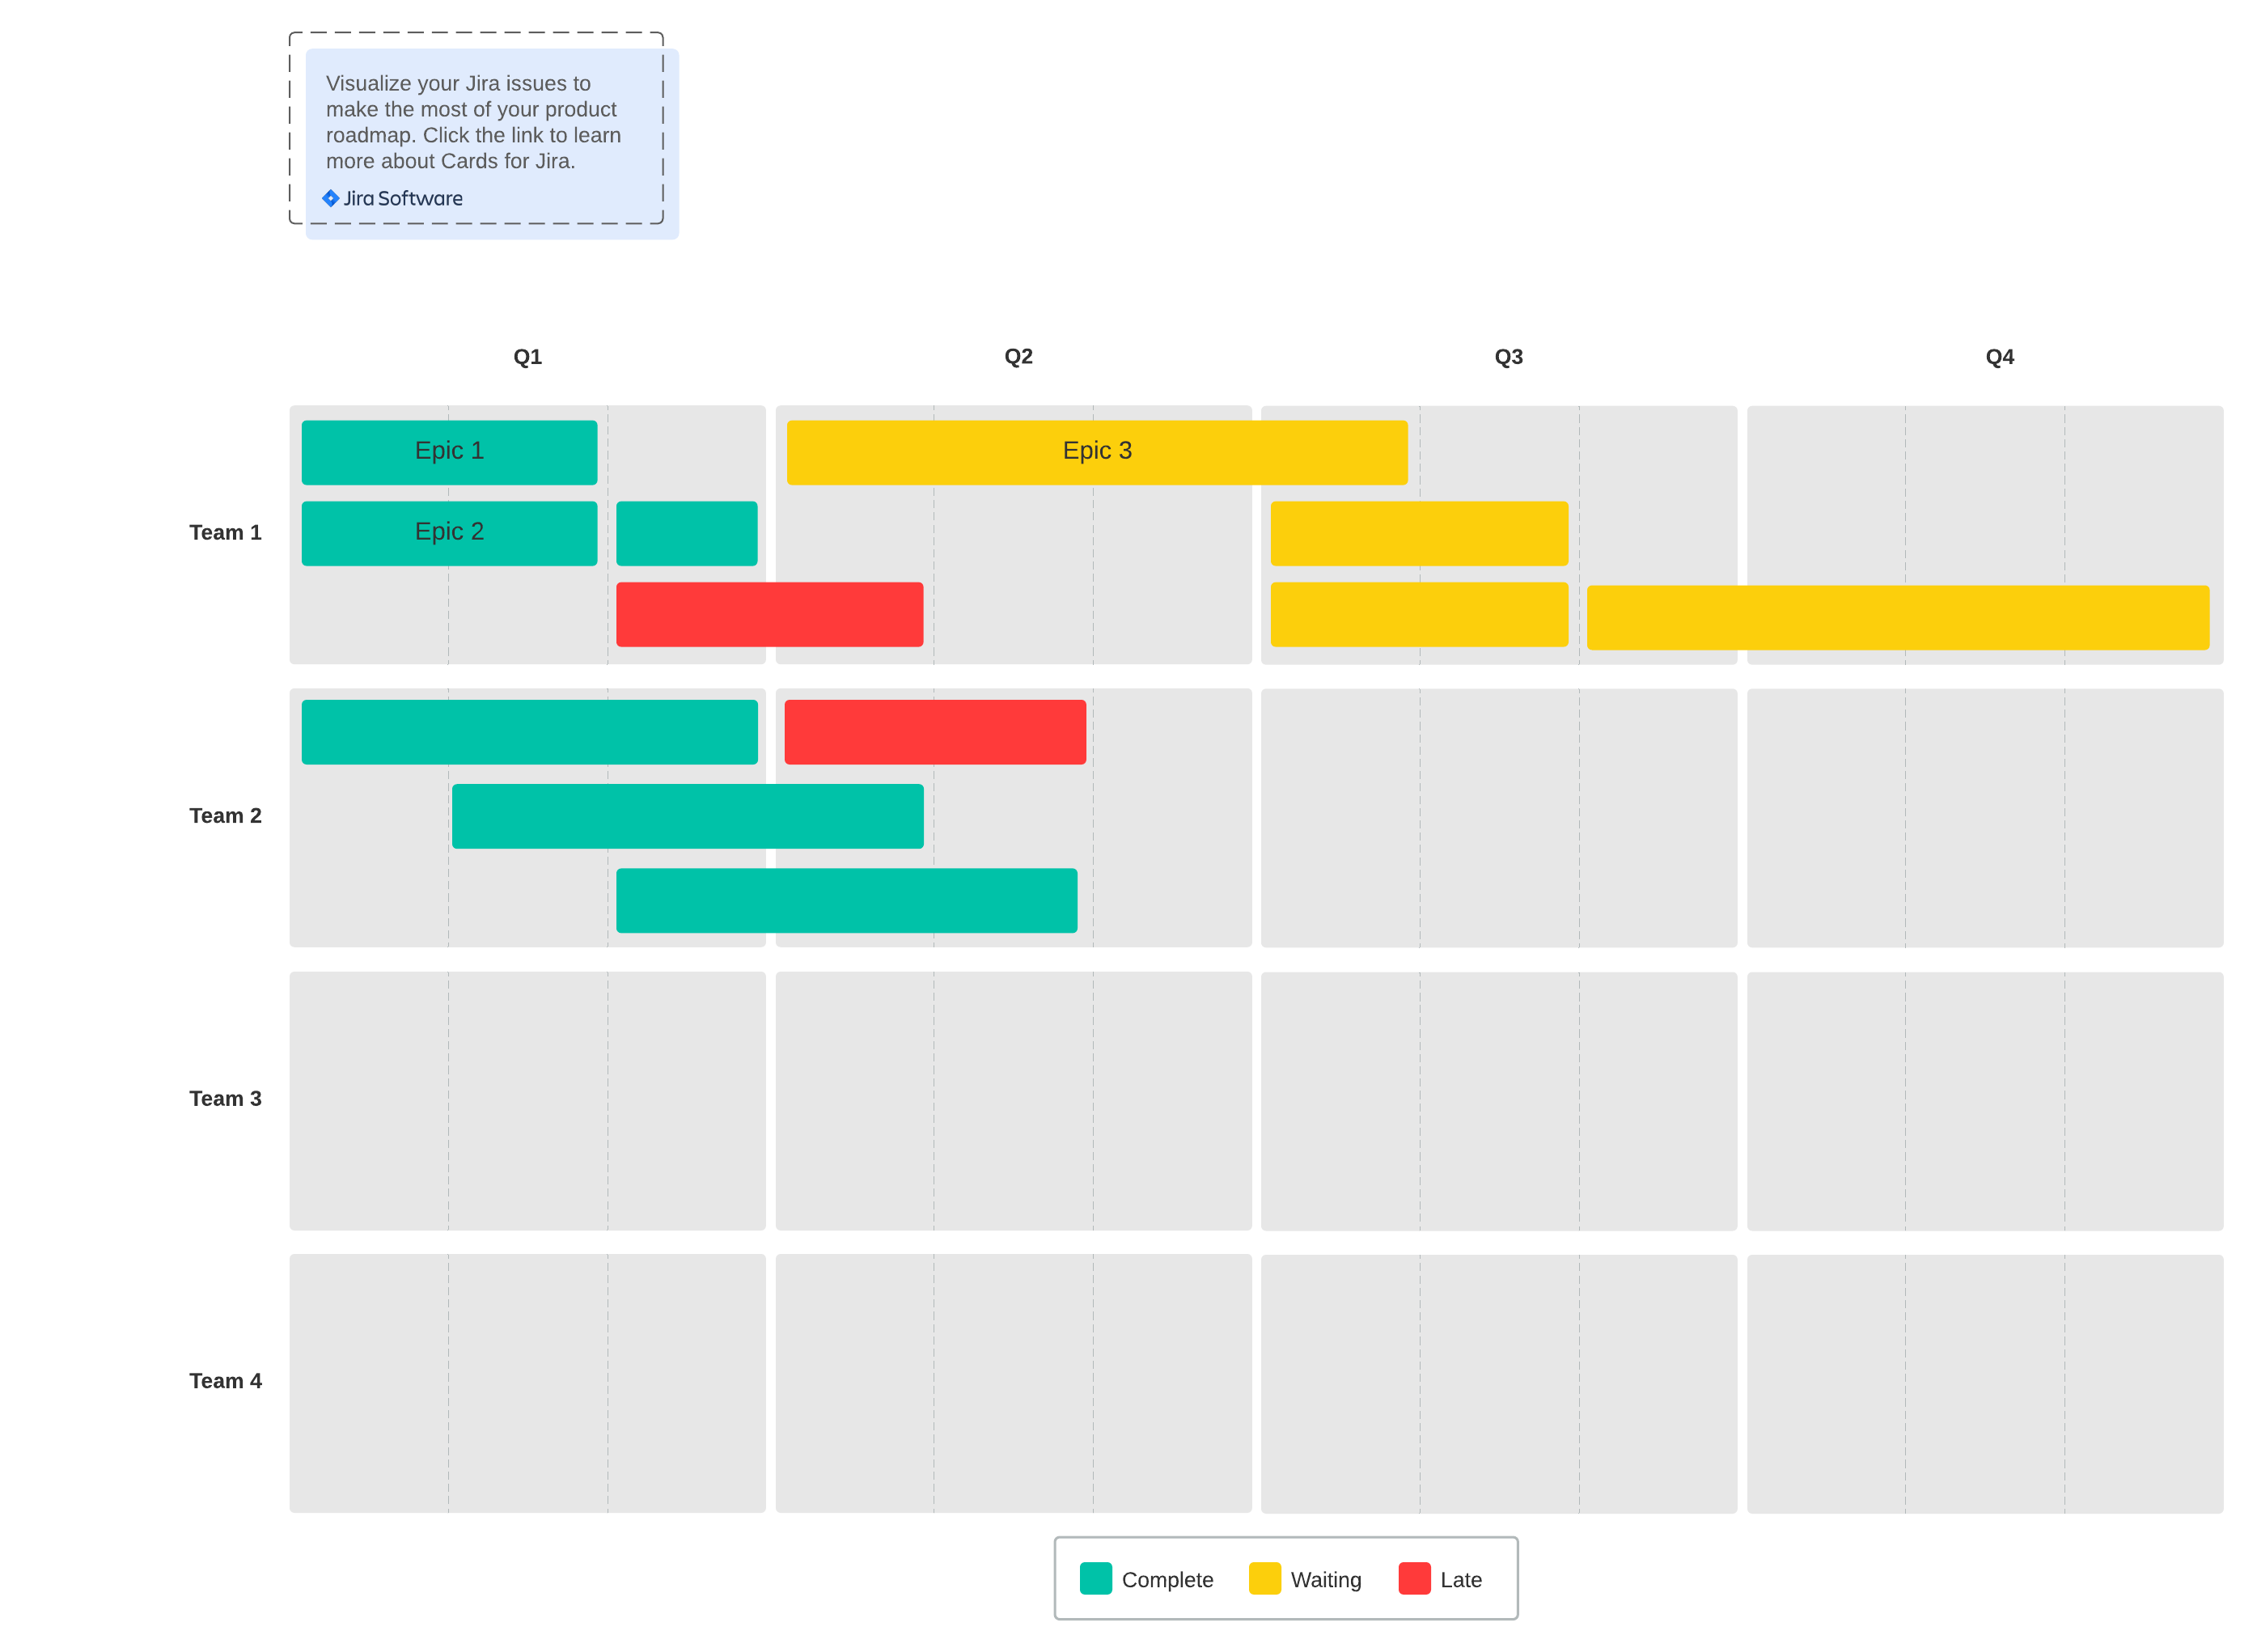
4. Add KPIs to product roadmaps
You can't measure what you don't track. Like exercise equipment stored away in a basement crawlspace, KPIs won’t get much use when they’re kept out of sight from those who rely on them to make daily (even hourly) improvements.
To enhance visibility and project alignment, attach your KPIs to a product roadmap. Just as the name implies, a product roadmap is a tool that helps teams navigate between two points. But instead of a destination or location, you are plotting a product’s development stages over a course of time.
Roadmaps not only help teams to visualize how to get a product to where we want it to be in the weeks or months ahead, they also keep everyone aligned (and updated) on the progress made. That’s why the best product roadmaps are online, interactive, and accessible to team members.
5. Reference KPIs during team meetings
In any data-driven, performance-minded workplace, KPIs play an active role in project planning sessions, kickoff meetings, department huddles, quarterly roadmaps, and annual reports. Why the high visibility for KPIs? To enhance focus and progress toward meaningful business goals.
When employees set annual goals, KPIs should be referenced as a means to measure personal improvement. Doing so will help ensure that individual tasks work toward KPIs, company-wide.
Once KPIs become part of the product-development mindset within your organization, creating them will become second nature. The more detailed your vision is for the solution you offer, the more it will help inform the KPIs of your product/service, which allows you to adapt to change.
Using KPIs for long-term success
KPIs are tools, not rules. To ensure your KPIs continue to drive the performance and success you want, regularly review them. Are the KPIs you’re using still relevant to the work and aligned with your business? As projects evolve over time or the business pivots in its strategies, some of your KPIs will likely need to change too.
Just be sure to communicate any changes to your KPIs and why you’re making those adjustments. Teams and organizations will get the most from their KPIs when they understand exactly what you are measuring, the purpose behind using those metrics, and how they connect to your overarching strategy.
Track and communicate your team KPIs with Lucid.

Determine the viability of your business model with our business model canvas.
Learn howAbout Lucidspark
Lucidspark, a cloud-based virtual whiteboard, is a core component of Lucid Software's Visual Collaboration Suite. This cutting-edge digital canvas brings teams together to brainstorm, collaborate, and consolidate collective thinking into actionable next steps—all in real time. Lucid is proud to serve top businesses around the world, including customers such as Google, GE, and NBC Universal, and 99% of the Fortune 500. Lucid partners with industry leaders, including Google, Atlassian, and Microsoft. Since its founding, Lucid has received numerous awards for its products, business, and workplace culture. For more information, visit lucidspark.com.
Related articles
How to stop running meetings and start facilitating them
In this article, we’ll dig into the difference between running a meeting and facilitating a meeting. We even cover the best practices to drive productive meetings.
How to facilitate effective kickoff meetings
This blog post will go over tips and best practices for project managers to run an effective kickoff meeting.
Using metrics in business: Measuring for success
Metrics can help you set realistic goals, track progress, and make informed decisions about business direction and strategy.
OKRs vs. KPIs
OKRs and KPIs are both valuable for your business. Learn about both of them in this article. Includes free templates!
Bring your bright ideas to life.
or continue with


By registering, you agree to our Terms of Service and you acknowledge that you have read and understand our Privacy Policy.