
Regardless of the industry you work in, problem-solving will be a part of your job. And when a problem does arise, you can either ignore it and hope it goes away (not recommended) or determine the cause of the problem and find ways to fix it.
It’s more common to ignore issues than you may think. But to maximize your team’s efficiency, you’ll need to establish a method of problem-solving that works for you. A cause and effect diagram is a perfect way to get started.
What is a cause and effect diagram?
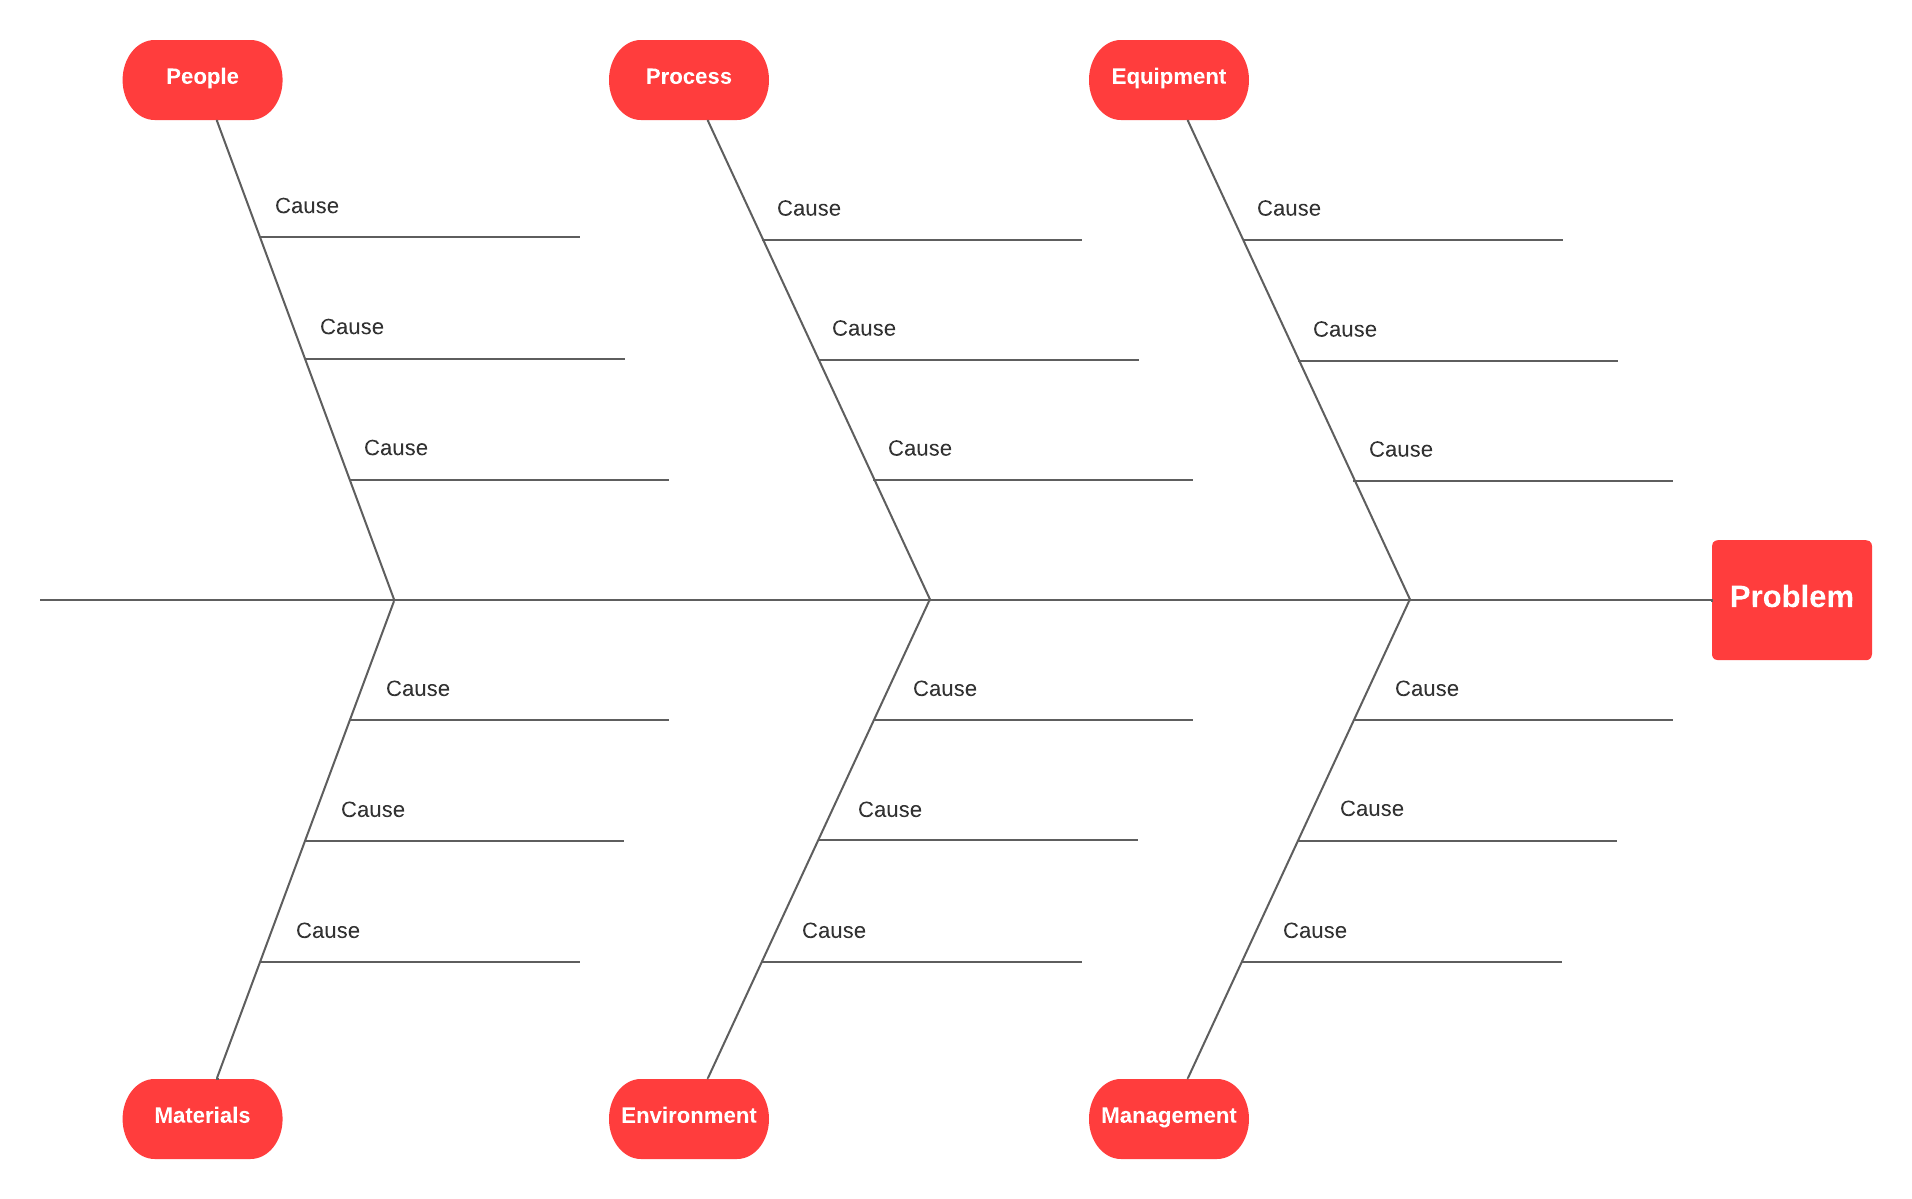
A cause and effect diagram (also called a fishbone diagram) is a visual tool that helps you examine the possible causes of a problem. Once you’ve determined the root issue, you can quickly solve it.
Fishbone diagram
The fishbone diagram was developed by Kaoru Ishikawa, a Japanese professor and expert in quality management. It got its name because it looks like a fish skeleton when completed. The “head” is the problem, and the “bones” represent the possible causes branching out from the head.
Fishbone diagrams are often called Ishikawa diagrams, herringbone diagrams, or cause and effect diagrams.
Fishbone diagram template
Before you work through the steps for a cause and effect analysis, consider exploring our fishbone diagram template, which you can edit for your use case. A virtual collaboration tool like Lucidspark lets you collaborate with remote team members, so you’re all aligned and focused on the same strategies.
If you would rather create a fishbone diagram from scratch, follow these basic steps:
- Identify your main issue or problem and write it in a box.
- Draw a long, horizontal line from the left edge of the box. This line is known as the spine.
- From the spine, draw short, angled branches. Each branch represents a potential cause of the main problem. Each branch can also have sub-branches.
How to perform a cause and effect analysis
A cause and effect analysis should be done in a team setting. Working with a team encourages creative thinking and allows you to examine the problem from different angles and perspectives.
If you perform an analysis independently, you risk introducing cognitive biases to the analysis. This can lead to identifying the wrong cause and trying to solve the wrong problem.
When performing a cause and effect analysis, consider:
- The present: What problem do you want to analyze, and what are the significant factors involved?
- The past: What might have caused the problem?
- The future: What are some solutions you can implement to keep the problem from happening again?
Step 1: Clarify the problem
To clarify the problem, you should include information like where and how often the problem occurs and who is involved. The more specific you can be, the narrower your focus is as you problem-solve.
Once you know the real issue, write it in the “problem” box in the diagram.
Step 2: Identify the major factors
What else is contributing to the problem? Factors might include systems or equipment, materials, environment, or people.
On the fishbone diagram, these factors are placed in boxes at the end of each angled branch (or bone) extending up or down the spine. Leave enough room to add possible causes under each.
Step 3: Identify possible causes
For each factor you’ve identified, perform a brainstorming session with your team to list possible causes.
For example, if you’re experiencing a bottleneck, you may have identified team members as one of the possible factors. In this step, you’d take it a step further and determine how team members could be affecting the issue. Maybe their training was inadequate, or their skills were insufficient.
On the fishbone diagram, draw horizontal lines branching from each angled factor line. Add possible causes to these horizontal lines.
Step 4: Analyze your diagram
Your fishbone diagram should now include all the possible causes of the problem. Next, narrow down your list by eliminating the least likely causes. This might require a lot of investigative work, interviews with employees, sending out surveys, and more.
For example, if there seems to be a consistent bottleneck at a specific workstation, your analysis and investigation can help you determine if the root cause is the equipment, the environment, or the employee working at that station.
Once you have identified the most likely root cause, you can create a plan to implement a solution that will fix the problem and prevent it from reoccurring. If you discovered that the cause of the issue was inadequate training, you could implement a standardized training process. That way, all employees—existing or new—would have the same understanding of the work processes.
Collaborate with Lucidspark
Lucidspark is easy to use and fosters creative ideas, effective collaboration, and visual problem-solving. Plus, your documents can be accessed anytime, anywhere in the world, making it perfect for distributed teams to problem-solve efficiently.

Explore hundreds of Lucidspark templates to help you with every use case.
Go nowAbout Lucidspark
Lucidspark, a cloud-based virtual whiteboard, is a core component of Lucid Software's Visual Collaboration Suite. This cutting-edge digital canvas brings teams together to brainstorm, collaborate, and consolidate collective thinking into actionable next steps—all in real time. Lucid is proud to serve top businesses around the world, including customers such as Google, GE, and NBC Universal, and 99% of the Fortune 500. Lucid partners with industry leaders, including Google, Atlassian, and Microsoft. Since its founding, Lucid has received numerous awards for its products, business, and workplace culture. For more information, visit lucidspark.com.
Related articles
Visual problem-solving: The secret sauce of successful teams
Supercharge your team’s problem-solving skills by implementing visuals to find the most effective solutions faster.
What is the problem-solving process?
Learn the components of the problem-solving process and techniques for problem-solving with your team (plus access free templates).
Bring your bright ideas to life.
or continue with


By registering, you agree to our Terms of Service and you acknowledge that you have read and understand our Privacy Policy.