
Visual problem-solving: The secret sauce of successful teams
Reading time: about 7 min
Topics:
Our brains process visual cues faster and more easily than written or verbal cues. That’s why many of us rely on landmarks to help us navigate around town and why outdoor advertising is heavy on images and light on text.
Because images can often convey meaning more effectively than words, implementing visuals into your problem-solving will help your team easily find solutions faster.
What is visual problem-solving?
Visual problem-solving includes using visual aids like flowcharts, maps, diagrams, and sticky notes in your problem-solving process.
Visual problem-solving helps you to:
- Understand the problem: Visuals reveal the way that different elements relate to each other, offering enhanced clarity.
- Simplify the problem: Visuals help identify past patterns in your work, allowing you to apply previous solutions to current issues. Visuals can also break down complex elements into smaller, more manageable pieces.
Your exact visual problem-solving process might vary, but it will likely include the following basic steps:
- Identify and understand the problem
- Gather information that pertains to the problem
- Brainstorm and identify missing pieces
- Select the best solution
- Develop a plan and implement the solution
- Review the results and revise as necessary
How can you make problem-solving more visual?
You don’t need to be an artist to make problem-solving more visual. Even doodles on a napkin can lead to great ideas. As long as your use of visuals allows you to examine issues from different perspectives, you’ll gain a better understanding of what you need to do to move forward.
Let’s break down the steps mentioned above to further explore how visuals can take your team to the next level of problem-solving.
Step 1: Identify and understand the problem
There are several different visual tools you can use that will help you identify and better understand the problem at hand. Here are just a couple of suggestions.
Mind maps
A mind map is a visual tool that closely aligns with how our brains work. You start with a central idea and then bounce from one thought to the next in a non-linear fashion while identifying relationships as you go.
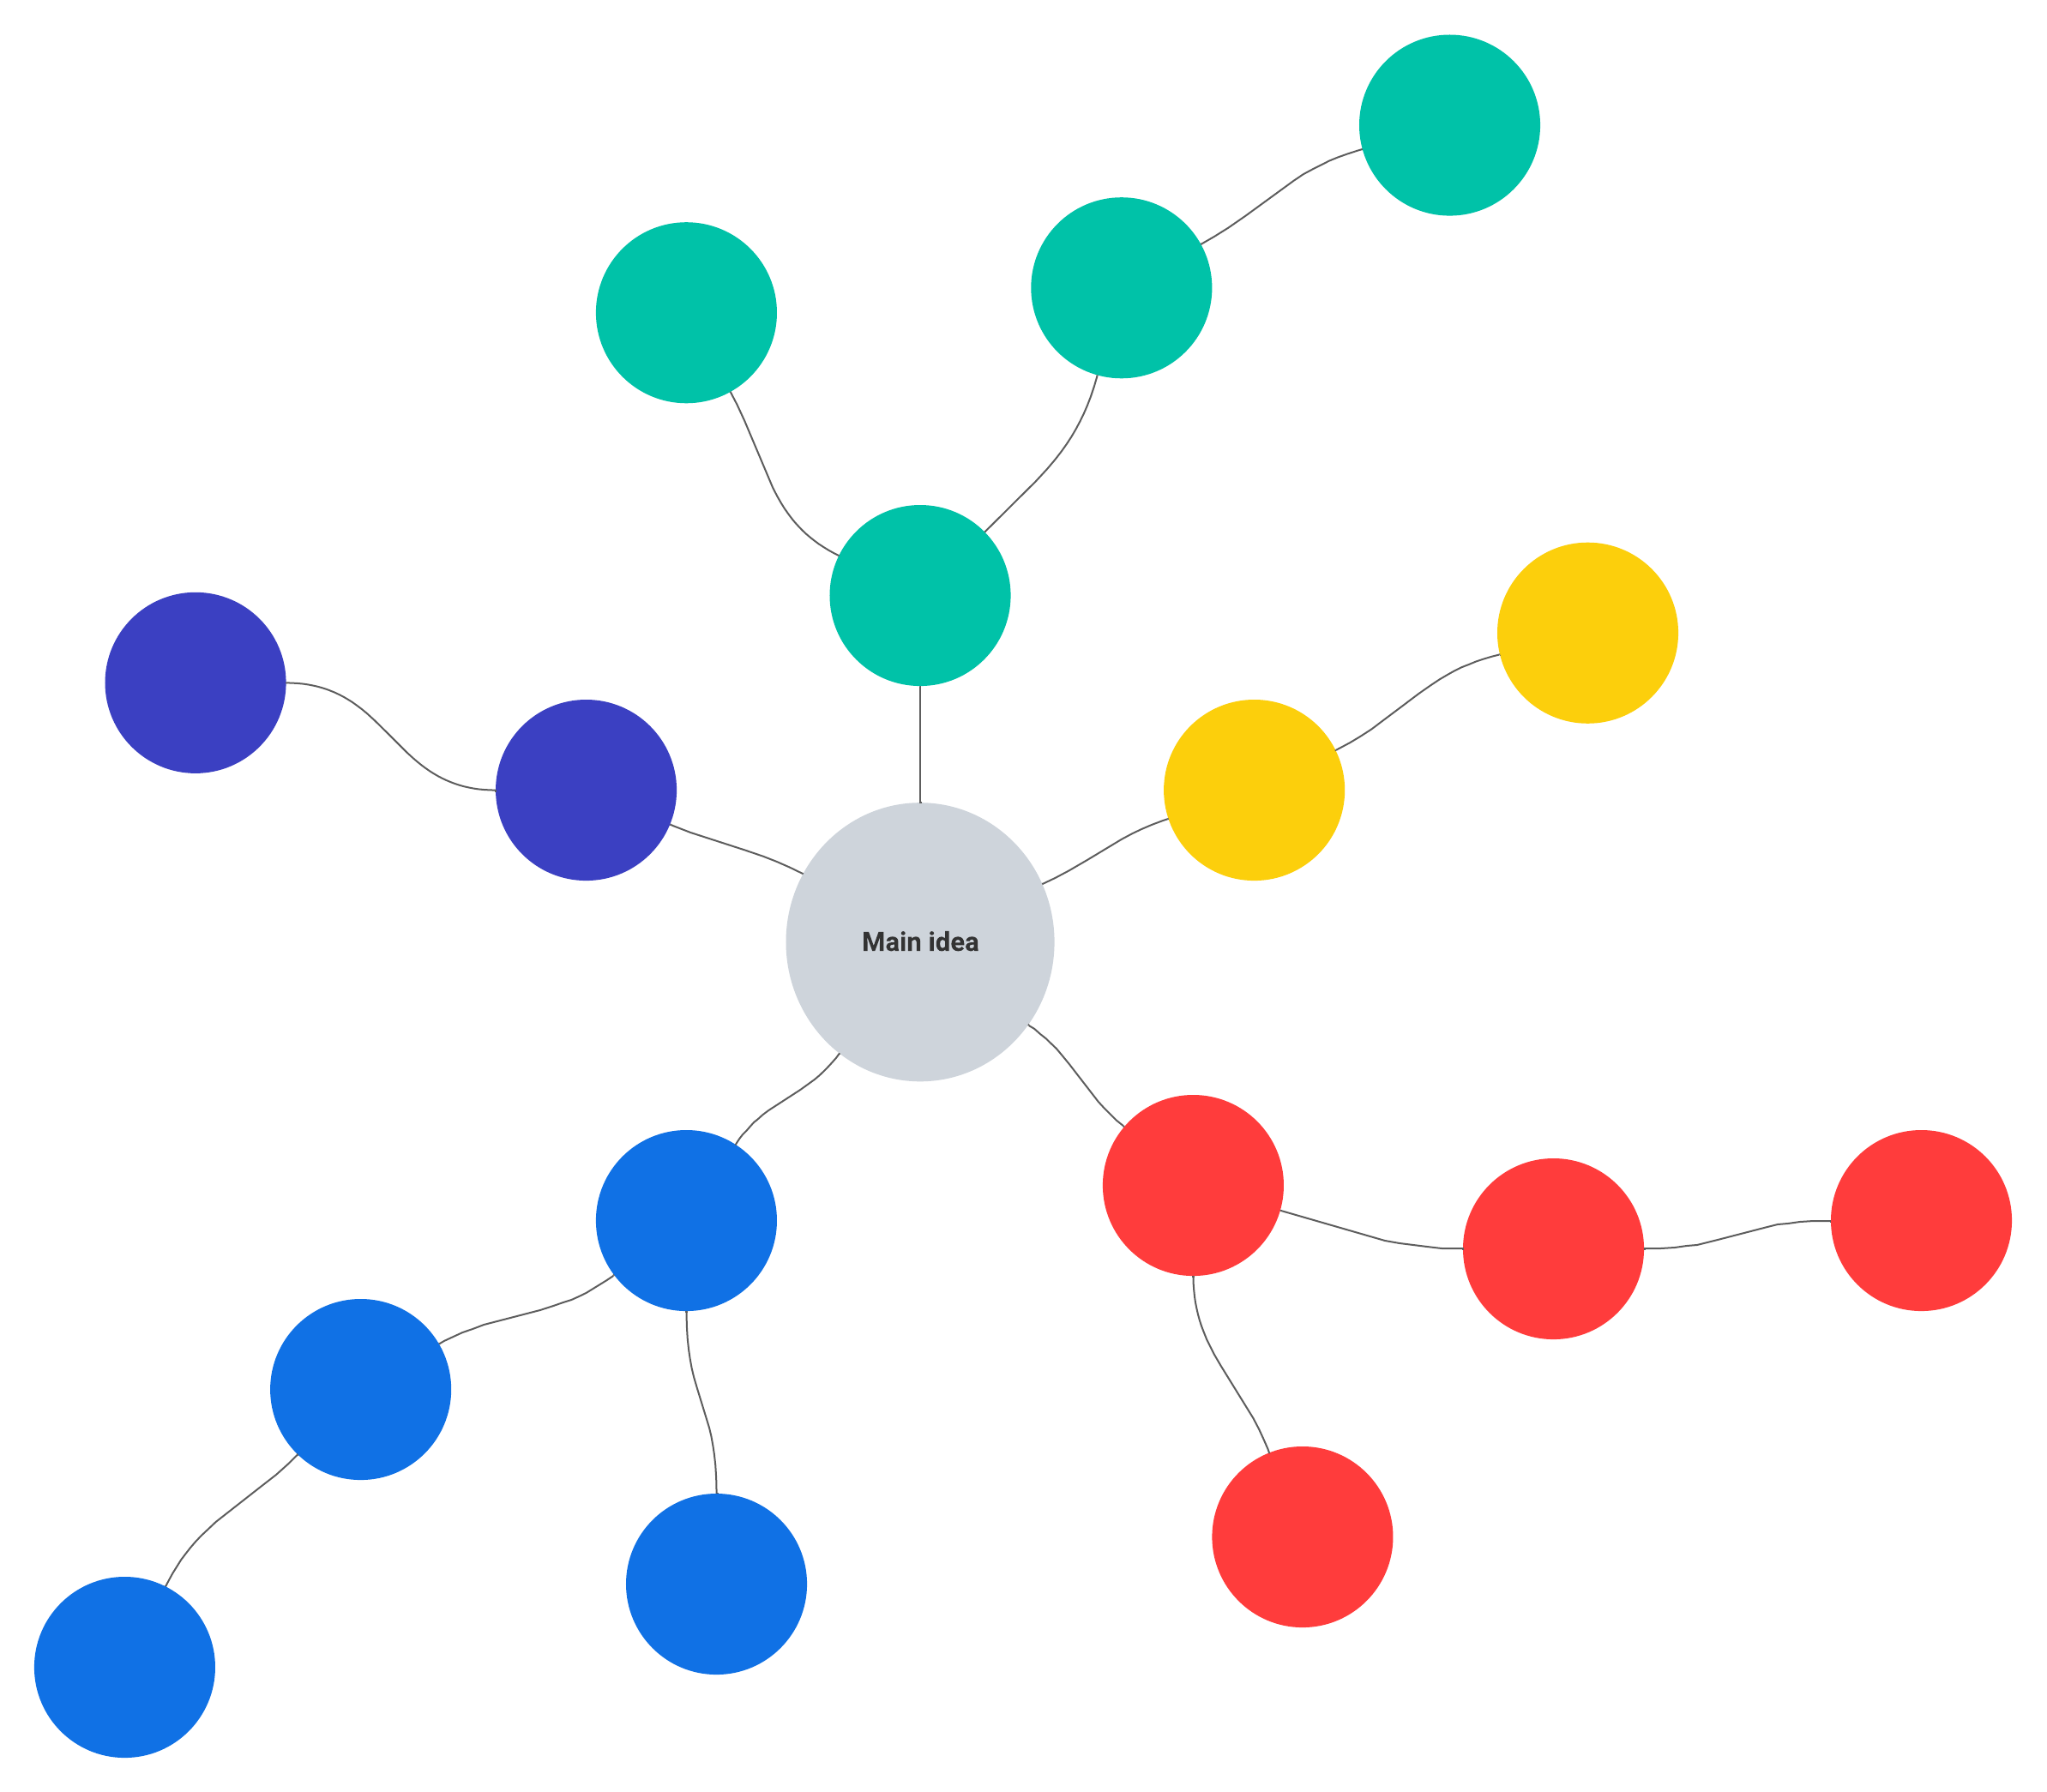
Steps for identifying a problem with a mind map might include:
- In the center of a page, digital canvas, or whiteboard, write the problem you’re dealing with.
- Surrounding your central idea, add what you think might be possible causes of the problem. Connect these ideas back to your initial problem with lines or arrows.
- Continue to branch out from each of the ideas circling your central problem. Add examples, details, and any information that will help you to further identify the root problem and its causes. Be sure to show connections between ideas while keeping the most important ideas closest to the center.
- Use different colors, diagrams, and shapes to organize the different levels of thought—anything that makes sense to you and helps you identify the most pertinent information.
Mind maps have an endless number of uses. Students can utilize mind maps to brainstorm essay topics, creatives can implement mind maps into their workflow to collect strategy ideas, and management teams can use mind maps to illustrate potential effects of company-wide initiatives.
Cause-and-effect diagrams
This type of diagram (also known as the Ishikawa or fishbone diagram) is perfect for root cause analysis in any industry because it allows you to explore all the potential causes of a problem.
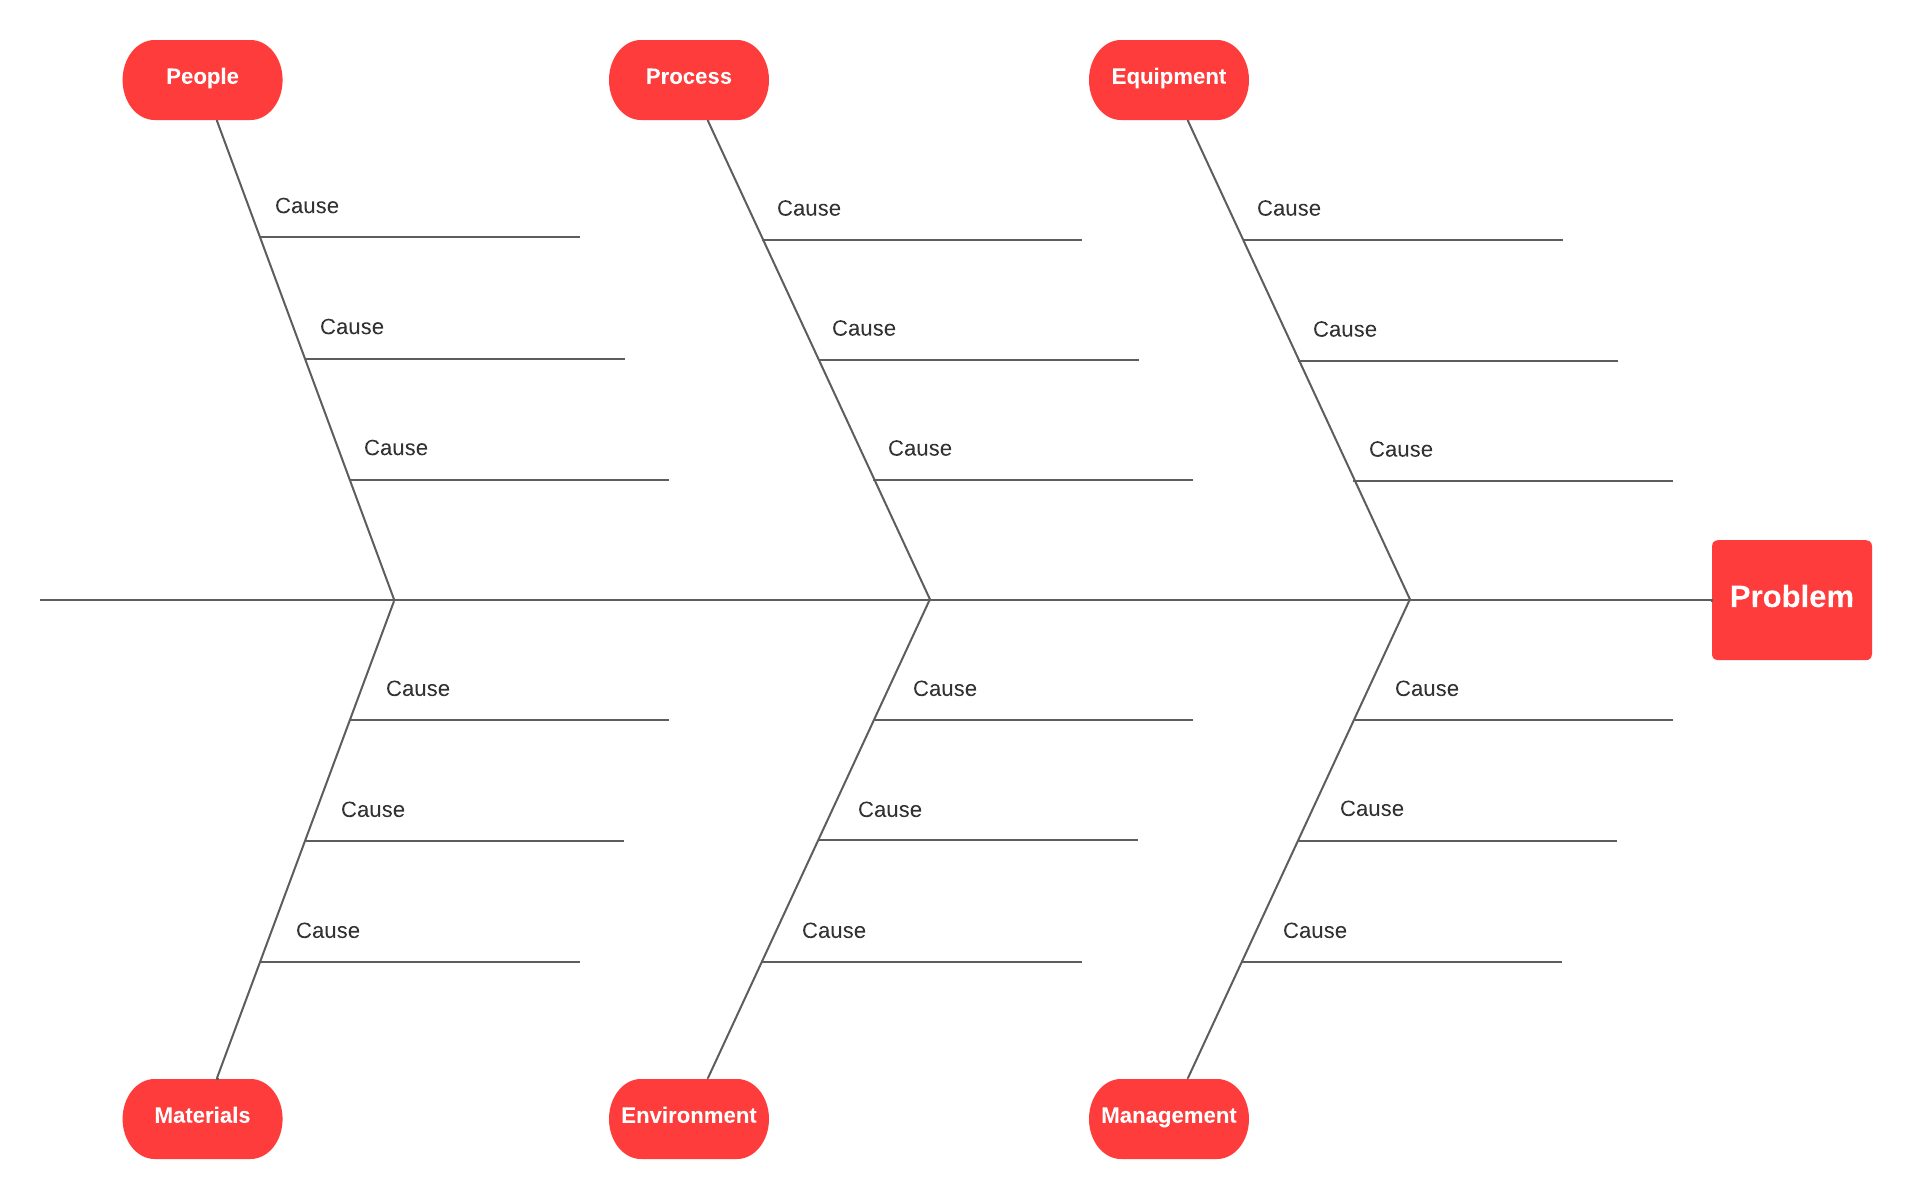
To draw a cause-and-effect diagram:
- In a box at the right side of a canvas or whiteboard, write your main issue or problem.
- Draw a horizontal line from the left edge of the box. This line is known as the spine.
- From the spine, draw angled branches that represent a potential cause of the main problem. Each branch can also have sub-branches that contain information that relate to the stated cause.
By analyzing the relationships between your potential causes, you can more easily pinpoint (and solve) the core problem.
Step 2: Gather information that pertains to the problem
Gather information from surveys, website statistics, and so on. Then examine this feedback through pie charts, graphs, sticky notes, and more. By presenting the information visually, you’ll be able to analyze it more efficiently.
Step 3: Brainstorm and identify missing pieces
When brainstorming, encourage quantity over quality. As they say, no ideas are bad ideas when brainstorming. Reinforcing this attitude will empower your team to think quickly, creatively, and collaboratively. It will also provide a platform for everyone to feel comfortable sharing ideas.
Unsurprisingly, this step also generally becomes more effective when visual diagrams are implemented. As previously mentioned, mind maps in particular are great tools to use in a brainstorming session.
Step 4: Select the best solution
You should have a board or canvas full of ideas now. Next, you’ll need to eliminate any proposed solutions that seem less feasible or effective than the others. Once you’re left with plausible ideas, analyze and discuss the potential outcomes of each to determine which one might work best to solve your problem.
You’ll often find that there isn’t just one obvious fix to your problem. You might need to combine several ideas into a solution that will best suit your needs.
One simple exercise developed by Tom Wujec, a pioneer in business visualization, asks you to take two to three minutes to draw your process for making toast. This helps emphasize both how different people think, as well as how many approaches there are to solving a problem.
An exercise like this encourages collaboration and provides your team with applied practice in brainstorming and identifying the best ideas.
Step 5: Develop a plan and implement the solution
To implement a solution, you need to develop a plan—even just a simple one. A plan ensures that your team understands the path to success and knows what actionable steps to take next.
Flowcharts are effective visual aids in plan creation because they typically represent a more linear set of sequences. Using specific shapes and connectors to represent steps and decision paths, it’s easy for people to understand a process flow from start to finish. For example, use a flowchart template to help new hires understand the organization of a company or to illustrate the steps of a work task, like using the copy machine or replacing the printer ink. Or, use flowcharts on a marketing team to visually prepare for a product rollout or an upcoming campaign.
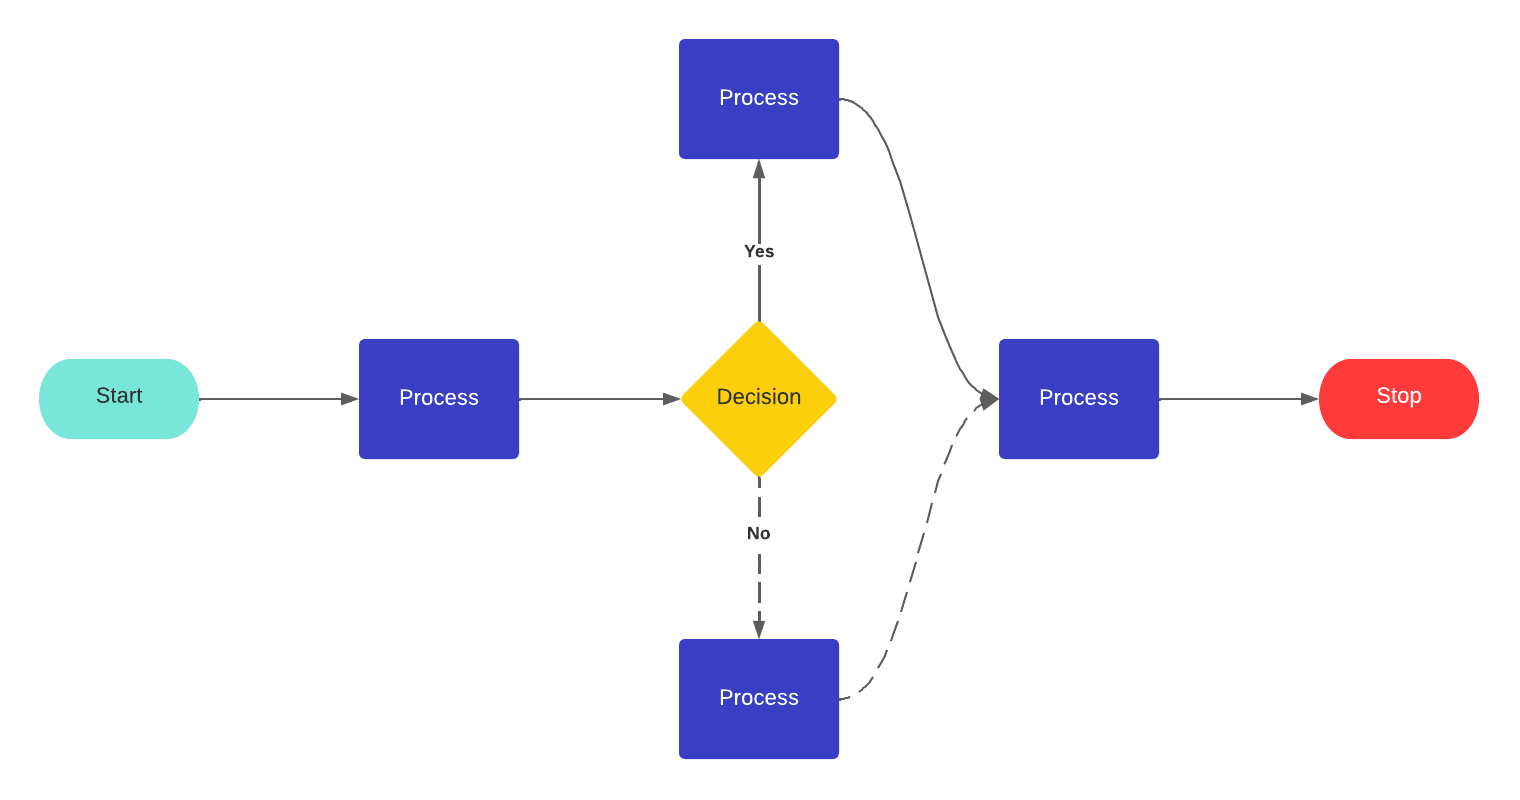
After implementing the solution, share the flowchart so everyone has access to the step-by-step plan. This helps your team members understand their role in the overall solution process.
Step 6: Review the results and revise as necessary
You may have fixed your problem, but that doesn’t mean you’re completely finished with the problem-solving process. Continue to monitor the implementation of your solution and analyze its results. That way, you can revise the process if necessary to increase effectiveness.
Flowcharts can be useful in this step, as well, to preemptively identify issues and process bottlenecks, anticipating and mitigating potential problems before they even occur.
Things to avoid with visual problem-solving
Cut down on inefficiency and wasted time by avoiding these common problem-solving mistakes:
- Not having a well-defined problem: Avoid trying to tackle too much at once. Break your problem down into smaller pieces and work your way up to the bigger problems.
- Giving up if your solution doesn’t work: Sometimes a clear answer is difficult to find, but exhaust all potential resources before throwing in the towel.
- Experiencing new problems when an initial solution is implemented: Don’t expect all issues to be solved right away. Ensure you’ve analyzed every facet of a possible solution in order to avoid future problems down the road.
- Failing to create an action plan: Without a strategic action plan, your team will struggle to align and act. Make sure to include a testing period within your plan.
As you get more comfortable using charts, diagrams, and other visuals, you’ll find that it’s easier for team members to quickly align and process important information. Potential problems will be easier to spot and data will make more sense.
Supercharge your problem-solving with a virtual whiteboard like Lucidspark. Lucidspark’s visual collaboration tools bring the whole team together no matter where they are located, keep ideas organized, and empower you to take action on the best ideas.

Take your problem-solving to the next level with Lucidspark.
Get started now.About Lucidspark
Lucidspark, a cloud-based virtual whiteboard, is a core component of Lucid Software's Visual Collaboration Suite. This cutting-edge digital canvas brings teams together to brainstorm, collaborate, and consolidate collective thinking into actionable next steps—all in real time. Lucid is proud to serve top businesses around the world, including customers such as Google, GE, and NBC Universal, and 99% of the Fortune 500. Lucid partners with industry leaders, including Google, Atlassian, and Microsoft. Since its founding, Lucid has received numerous awards for its products, business, and workplace culture. For more information, visit lucidspark.com.
Related articles
What is a mind map?
A complete guide to understand mind mapping, how mind maps are often used, and steps to make a mind map of your own.
What is a spaghetti diagram? [+template]
We're diving into spaghetti diagrams and sharing what they are and how to make your own. Includes a free template!
Bring your bright ideas to life.
or continue with


By registering, you agree to our Terms of Service and you acknowledge that you have read and understand our Privacy Policy.