
Even tasks that seem straightforward can quickly balloon to an unmanageable mess. But project management is easier if you use the right tools. And here’s even better news: the right tool for managing a project is easy, intuitive, and highly visual. It’s called a Gantt chart, and it’s a great way to harness all kinds of projects, from those that seem simple to those that seem moderately impossible. We’ll show you how to get going on organizing your own Gantt chart with the help of Lucidspark.
We Gantt wait for you to get started.
What’s a Gantt chart?
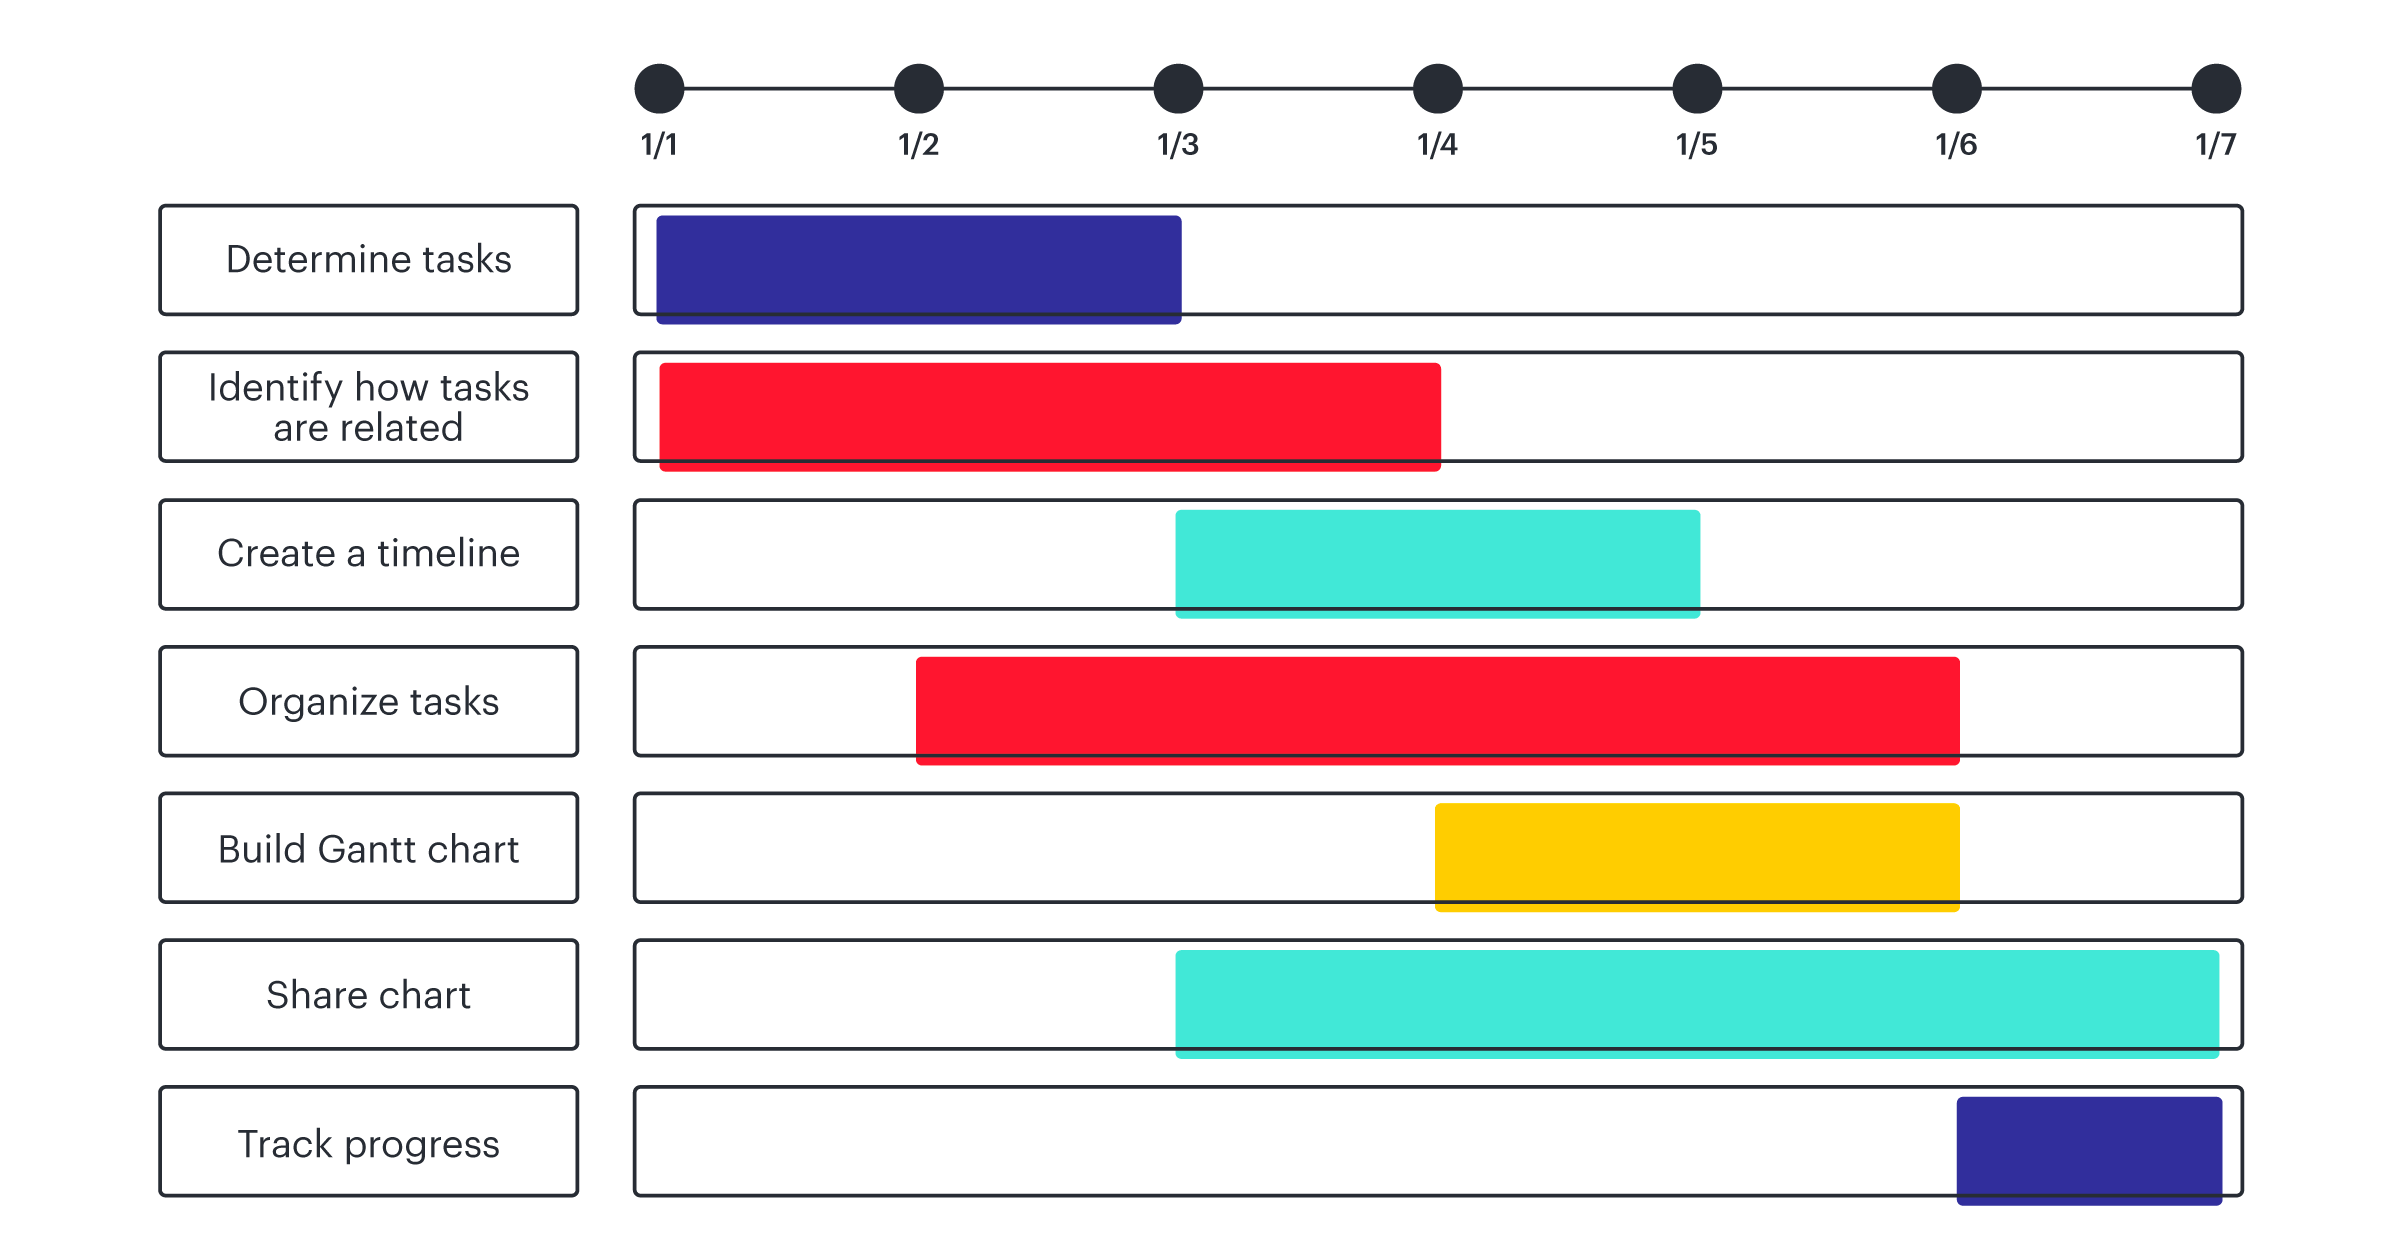
A Gantt chart is a chart that contains bars showing time and the necessary steps—or tasks—needed to complete a project. Those tasks are assigned to team members and displayed on bars that align with due dates on the top of the chart. At one glance, you can tell who’s working on what, and when each task should be completed. You can also see dependencies for each task and which tasks can be worked on simultaneously.
The Gantt chart was developed in 1896 by Karol Adamiecki, a Polish economist, engineer, and management researcher. (Coincidentally, this was also the year the Tootsie Roll was introduced by Leo Hirshfield, so it’s a year worth remembering.) Adamiecki emphasized harmonious work based on graphical analysis, and his desire for work harmonization turned into an early version of the Gantt chart called the “harmonogram.”
This was then updated by Henry Gantt, an American engineer and management consultant, when he was hired to help the U.S. army prepare for its entry to World War I. The Gantt chart reflects his management theory, which emphasizes resources and time, and was designed to show a comparison between performance and promises. But there were some major issues with these early charts:
- They didn’t show interdependencies and
- They were drawn on paper, so if anything changed, they had to be completely redrawn.
Thankfully, modern iterations of the Gantt chart keeps everyone working harmoniously towards a common goal without requiring the chart to be redrawn from scratch whenever something changes.
Benefits of using a Gantt chart
You’ll likely discover your own reasons to love Gantt charts as you begin incorporating them into your work processes, but here are some common reasons why people turn to these handy visuals:
- Progress tracking—You’ll know where the project stands at any given point.
- Team alignment—The team signs off on the project and tasks ahead of time.
- Manageability—Daunting projects are broken down into smaller, manageable tasks that are easier to handle.
- Showing dependencies—It’s easy to overlook dependencies when tasks aren’t being tracked, and that leads to bottlenecks that can put your due date at risk.
- Resource management—Know who’s needed where and what they will contribute. Prevent burnout and know who will need extra support.
How to create a Gantt chart
Ready to create your own Gantt masterpiece? Here’s a step-by-step guide:
Determine your tasks and subtasks
You’ll be surprised how many tasks are required for even a basic project. To make sure you’re not forgetting any tasks, use this step as an opportunity to use a virtual whiteboard like Lucidspark with sticky notes to brainstorm tasks and subtasks. Solicit input from various teams and stakeholders that might present alternative points of view. Once you’ve brainstormed, it’s easy to move these notes around during the subsequent steps.

Identify how tasks are related
There are two types of ways tasks are related within a Gantt chart:
- Parallel tasks—Tasks that can be worked on concurrently
- Sequential tasks—Tasks with dependencies
In your virtual whiteboard, move sticky notes around to denote which tasks require the completion of previous tasks before they can be performed. If there are tasks that can be completed independently, put them in their own container.
Create your timeline
The easiest way to do this is to work backwards, especially if you have an absolute hard deadline for the project. If you don’t, determine an estimate for how long each task should take, then arrange them on the chart accordingly. It’s a good idea to overestimate how long tasks should take. That way, unforeseen circumstances won’t throw the entire project off course.
Organize your tasks
This part is satisfying. Go through the tasks with dependencies and create a sequential order for them. Boom–you now know where to put your tasks in your Gantt chart.
Build your Gantt chart in Lucidspark
Of course, we have a Gantt chart template. You don’t have to reinvent the wheel. First, open up the Gantt chart template in Lucidspark. Then, fill in the tasks you’ll need to complete, as decided on during your brainstorm. Tasks are on the left-hand side of the Gantt chart. There are only nine in the template, but you can easily copy/paste an infinite number of tasks (the same goes for any other object in the chart).
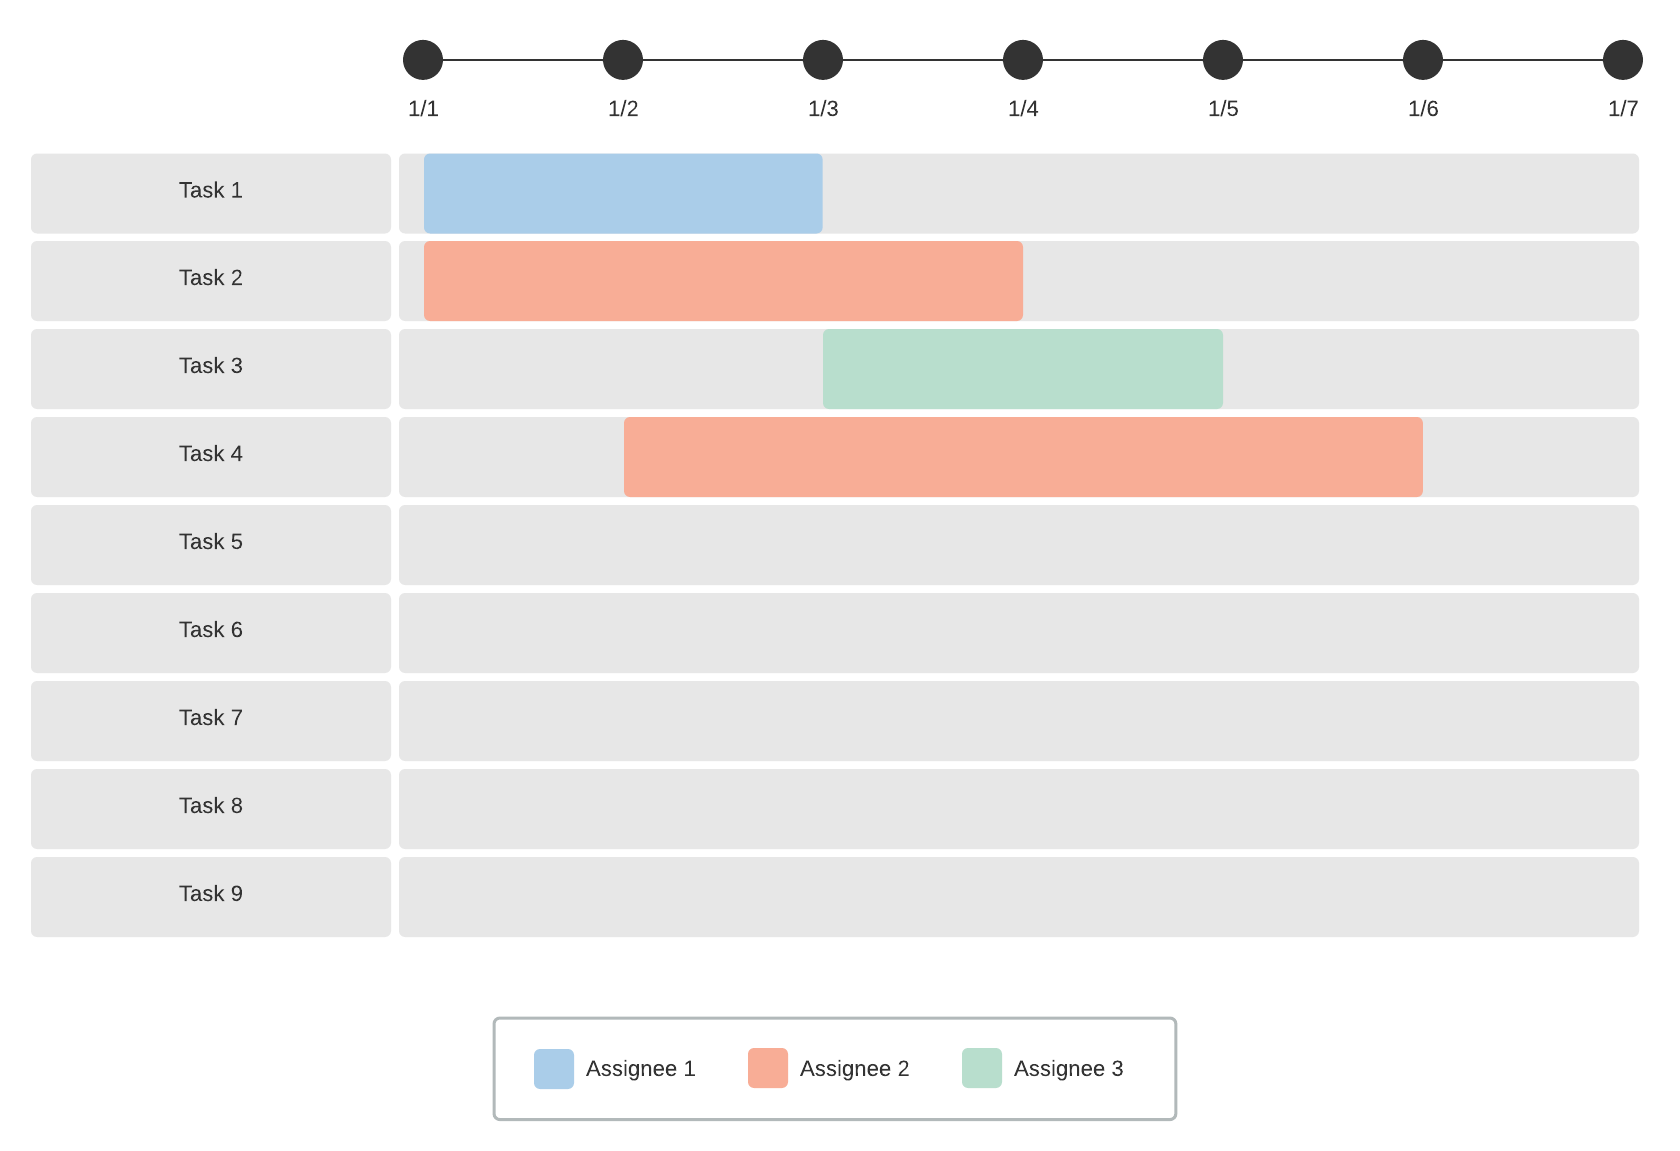
Assign a color to each team or team member, and indicate that color in the legend at the bottom of the chart. Each task has a corresponding bar that visually shows the duration of the task. Simply change the top axis of the chart to the appropriate calendar, then stretch or shrink the task bars to visually indicate when each task is due.
When your Gantt chart is finished, you’ll notice that tasks with dependencies aren’t scheduled to start until the dependencies have been completed. You’ll also see that parallel tasks have—fittingly—parallel bars.
Share your chart
One of the best parts of using a Lucidspark chart is how easy it is to share boards and keep everyone on the same page. You can share with anyone by clicking the paper airplane “share” button in the upper right corner. And, because the chart is stored in the cloud, the people you’ve shared the chart with will always have the most up-to-date version of the chart.

This is the time for you to ask for feedback on the chart. It’s much, much easier to change the timeline or dependencies or other issues before the project begins than to suddenly have to rearrange things in the middle of a project. Get confirmation from every assignee that they understand the tasks they’ve been assigned and anticipate they will finish them by the date indicated.
Track your progress
With your entire project charted, it’s time to sit back and watch the tasks make their merry way towards completion.
While Gantt charts are commonly used by project managers, they’ve been used by all types of roles in all kinds of industries. You can even use a Gantt chart for personal use to keep track of a project you have sole ownership of. The best part of using a Gantt chart is how clear it makes every project. Suddenly, an overwhelming software launch seems totally doable. And instead of the team being paralyzed with anxiety over a massive project, breaking it down into bite-sized tasks helps everyone breathe easier.

Easily build a Gantt chart in Lucidspark and share it with your team today.
Keep your projects on trackAbout Lucidspark
Lucidspark, a cloud-based virtual whiteboard, is a core component of Lucid Software's Visual Collaboration Suite. This cutting-edge digital canvas brings teams together to brainstorm, collaborate, and consolidate collective thinking into actionable next steps—all in real time. Lucid is proud to serve top businesses around the world, including customers such as Google, GE, and NBC Universal, and 99% of the Fortune 500. Lucid partners with industry leaders, including Google, Atlassian, and Microsoft. Since its founding, Lucid has received numerous awards for its products, business, and workplace culture. For more information, visit lucidspark.com.
Bring your bright ideas to life.
or continue with


By registering, you agree to our Terms of Service and you acknowledge that you have read and understand our Privacy Policy.