Burndown chart
Use this burndown chart to keep track of the progress that your team has made during an agile sprint. Try it free today!
What is a burndown chart?
A burndown chart is a visual way of displaying the amount of work left to complete along with the time left in which to complete it. Burndown charts aren’t necessarily required for Scrum or Agile teams, but they do fit nicely within those frameworks because they provide transparency and visual progress.
Benefits of the burndown chart template
It’s easy to set up and maintain. A burndown chart requires really knowing two things: how much work there is and how much time is left to do the work. Each day, the team updates progress for transparency.
It’s motivating. Visually seeing how well your team is doing provides a realistic understanding of how much work is left to complete. That can often be the determining factor in motivating everyone during a lull.
It improves future sprints. Understanding the reality of how much time it will take to complete a certain amount of work is useful for determining the amount of time needed to complete future tasks. Each iteration improves on the last.
It saves time. Having progress tracked in one place allows for everyone to understand a project’s current state without having to search through several different documents.
How to use the burndown chart template in Lucidspark
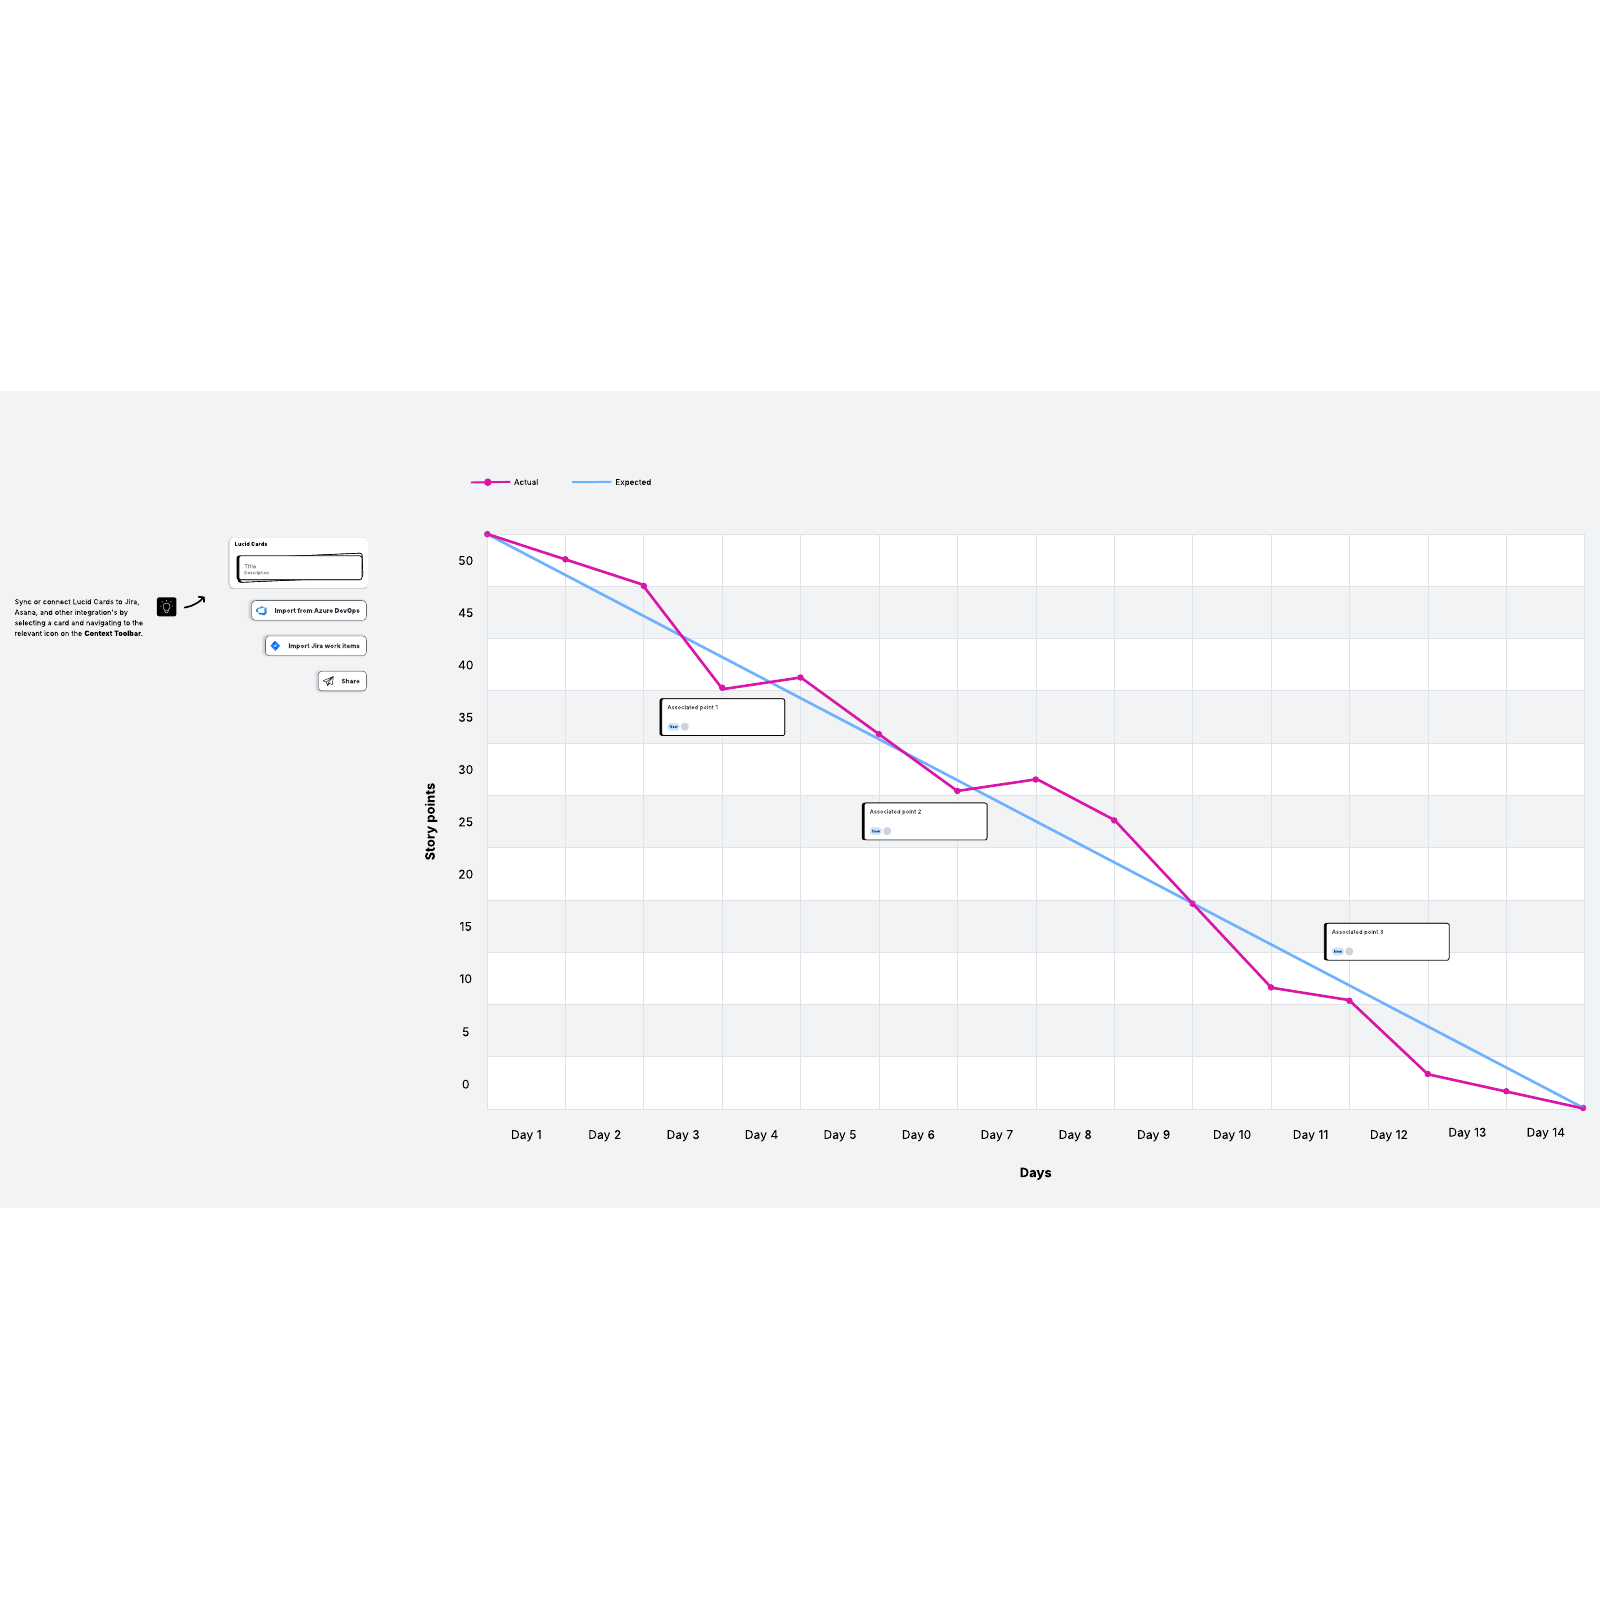
- Determine work. Your team may be using story points, hours of work, or another unit from the product backlog to define the amount of work needed. Discuss this with your team and plot on the vertical axis.
- Set the time frame. Estimate when the remaining work you’ve determined will be completed. You can use days, hours, sprints, or any other unit to measure time. Indicate this on the horizontal axis.
- Define the best-case scenario. Draw a line plotting how much work the team estimated it could complete in the time allotted. This shows your ideal progress and will allow you to compare the actual time to the guesstimate for future planning.
- Track actual progress. Use a different colored line to track your team’s progress. Update the chart daily and compare it to the ideal line to determine if you are on track, behind, or ahead of schedule. As a team, you can then make any necessary adjustments.
- Share and reference your chart regularly. It’s easy to export the Lucidspark template to a different format to share with your team and keep sprint progress top of mind. Using whatever format works best for your team, reference your charts to identify trends and potential process improvements.


